Grafana
This page lists Robusta actions related to Grafana.
Like all Robusta actions, these can be triggered by Prometheus/AlertManager, Kubernetes changes, and more.
Prerequisites
You will need a Grafana API key with write permissions.
Builtin actions
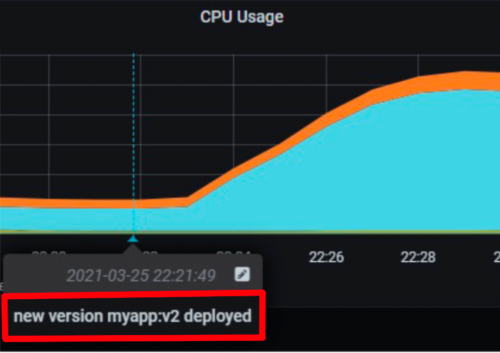
Add deployment lines to grafana
Playbook Action: add_deployment_lines_to_grafana
Add annotations to Grafana when a Kubernetes resource is updated and the image tags change.
Supports Deployments, ReplicaSets, DaemonSets, StatefulSets, Jobs, and Pods
Add this to your Robusta configuration (Helm values.yaml):
customPlaybooks:
- actions:
  - add_deployment_lines_to_grafana:
      grafana_api_key: '********'
      grafana_dashboard_uid: 09ec8aa1e996d6ffcd6817bbaff4db1b
      grafana_url: http://grafana.namespace.svc
  triggers:
  - on_deployment_update: {}
The above is an example. Try customizing the trigger and parameters.
- grafana_api_key (str)
grafana key with write permissions.
- grafana_dashboard_uid (str)
dashboard ID as it appears in the dashboard's url
- grafana_url (str)
http(s) url of grafana or None for autodetection of an in-cluster grafana
- grafana_dashboard_panel (str)
when present, annotations will be added only to panels with this text in their title.
- cluster_name (str)
written as one of the annotation's tags
- cluster_zone (str)
- custom_tags (str list)
custom tags to add to the annotation
on_kubernetes_warning_event_delete
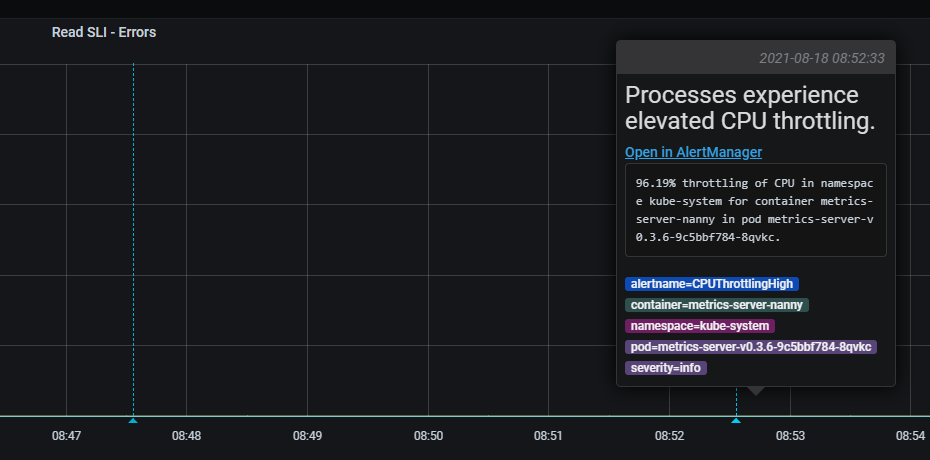
Add alert lines to grafana
Playbook Action: add_alert_lines_to_grafana
No description
Add this to your Robusta configuration (Helm values.yaml):
customPlaybooks:
- actions:
  - add_alert_lines_to_grafana:
      grafana_api_key: '********'
      grafana_dashboard_uid: 09ec8aa1e996d6ffcd6817bbaff4db1b
      grafana_url: http://grafana.namespace.svc
  triggers:
  - on_prometheus_alert: {}
The above is an example. Try customizing the trigger and parameters.
- grafana_api_key (str)
grafana key with write permissions.
- grafana_dashboard_uid (str)
dashboard ID as it appears in the dashboard's url
- grafana_url (str)
http(s) url of grafana or None for autodetection of an in-cluster grafana
- grafana_dashboard_panel (str)
when present, annotations will be added only to panels with this text in their title.
- cluster_name (str)
written as one of the annotation's tags
- cluster_zone (str)
- custom_tags (str list)
custom tags to add to the annotation
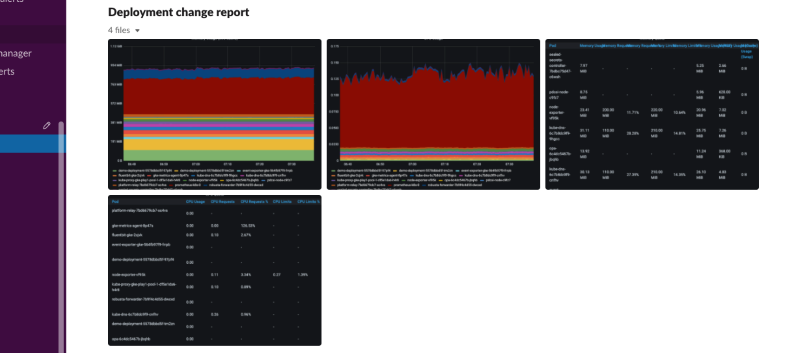
Deployment status report
Playbook Action: deployment_status_report
Collect predefined grafana panels screenshots, after a deployment change. The report will be generated in intervals, as configured in the 'delays' parameter. When the report is ready, it will be sent to the configured sinks.
Make sure to set 'grafanaRenderer.enableContainer' to 'true' in the values yaml to use this action.
Add this to your Robusta configuration (Helm values.yaml):
customPlaybooks:
- actions:
  - deployment_status_report:
      delays:
      - 1
      - 1
      grafana_api_key: '********'
      reports_panel_urls:
      - http://MY_GRAFANA/d-solo/SOME_OTHER_DASHBOARD/.../?orgId=1&from=now-1h&to=now&panelId=3
  triggers:
  - on_deployment_update: {}
The above is an example. Try customizing the trigger and parameters.
- grafana_api_key (str)
Grafana API key.
- delays (int list)
List of seconds intervals in which to generate this report.
Specifying [60, 60] will generate this report twice, after 60 seconds and 120 seconds after the change.
- reports_panel_urls (str list)
List of panel urls included in this report.
it's highly recommended to put relative time arguments, rather then absolute. i.e. from=now-1h&to=now
- report_name (str) = Deployment change report
The name of the report.
- fields_to_monitor (str list) = ['image']
List of yaml attributes to monitor. Any field that contains one of these strings will match.