Managed Prometheus Alerts
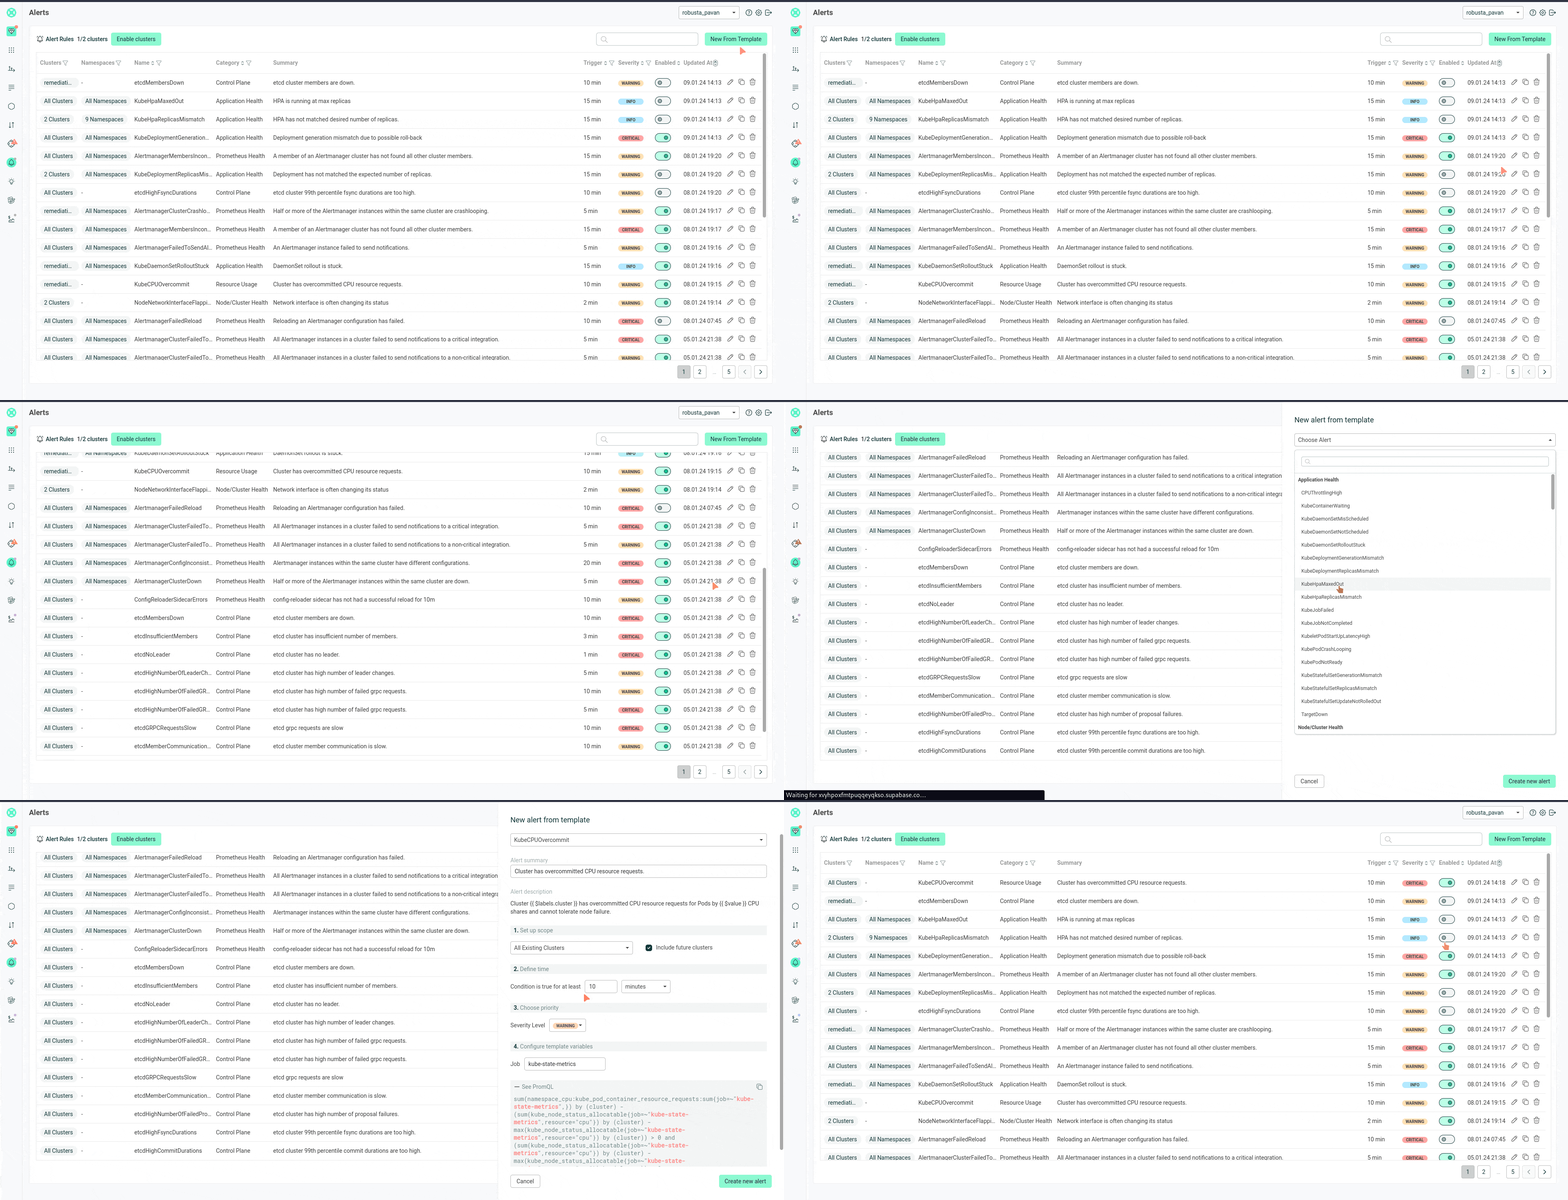
You can manage your Prometheus alerts with the Robusta Alerts UI, instead of managing them as PrometheusRule YAMLs in-cluster.
This lets your team create and customize Prometheus alerts with templates, without needing to know PromQL.

This guide covers how it works, and also the steps involved to use this feature.
How it works
Robusta manages the list of alerts in the Robusta UI and syncs them to your clusters as managed PrometheusRule files (CRDs).
You can disable/enable individual alerts and change thresholds via the UI.
Robusta uses the enabledManagedConfiguration Helm value to determine whether to sync alerts from the Alerts UI to your cluster, by default in generated_values.yaml it is set to true.
enabledManagedConfiguration: true
Important to mention that Robusta stores its managed rules in PrometheusRules custom resources that start with robusta-prometheus.rules--. If left in the cluster, you might have double alerts.
Enable Alerts UI for your cluster
Choose the appropriate instructions below, based on whether you use the Prometheus bundled with Robusta or your own Prometheus.
Make sure that the enabledManagedConfiguration value is set to true in generated_values.yaml:
enabledManagedConfiguration: true
Then perform a Helm Upgrade.
First, ensure you have the Prometheus operator installed by running the following command:
kubectl get crd | grep prometheus
To make sure Prometheus picks up Robusta's rule files, add the following to the Kube Prometheus Stack configuration:
prometheus: # collect rules from all namespaces and ignore label filters
    ruleNamespaceSelector: {}
    ruleSelector: {}
    ruleSelectorNilUsesHelmValues: false
Finally, make sure that the following snippet is in Robusta’s Helm values file named generated_values.yaml:
enabledManagedConfiguration: true # Enables managed alerts
Then perform a Helm Upgrade.
Customizing PrometheusRule Labels and Group Name
When you create alerts in the Robusta Alerts UI, they are synced to your cluster as PrometheusRule CRDs. You can customize the labels and group name that are applied to these UI-created rules.
Add the following to your globalConfig section in generated_values.yaml:
globalConfig:
  # Custom group name for PrometheusRule alerts created from the Robusta Alerts UI
  prometheus_rule_group_name: "robusta-rule-group"

  # Custom labels to add to PrometheusRule metadata for rules created from the UI
  prometheus_rule_custom_labels:
    my_label: "my_value"
Then perform a Helm Upgrade.
Note
These settings only apply to PrometheusRules created from the Robusta Alerts UI.
Disabling the Feature
If you choose to stop using the Robusta Alerts UI
Set
enabledManagedConfiguration: falseingenerated_values.yamland do a Helm Upgrade.Identify the PrometheusRule custom resources added by Robusta
kubectl get prometheusrules -A | grep robusta-prometheus
Modify and run the following command for all the Robusta rule custom resources present in your cluster.
kubectl delete prometheusrules.monitoring.coreos.com robusta-prometheus.rules<VALUE> -n <NAMESPACE>