Log-based alerting and auto-remediation with fluentbit, prometheus, and robusta
This tutorial walks you through building an automation that detects specific patterns in Kubernetes pod logs and responds automatically.
For example, we’ll show how to restart a pod if it logs a database connection error.
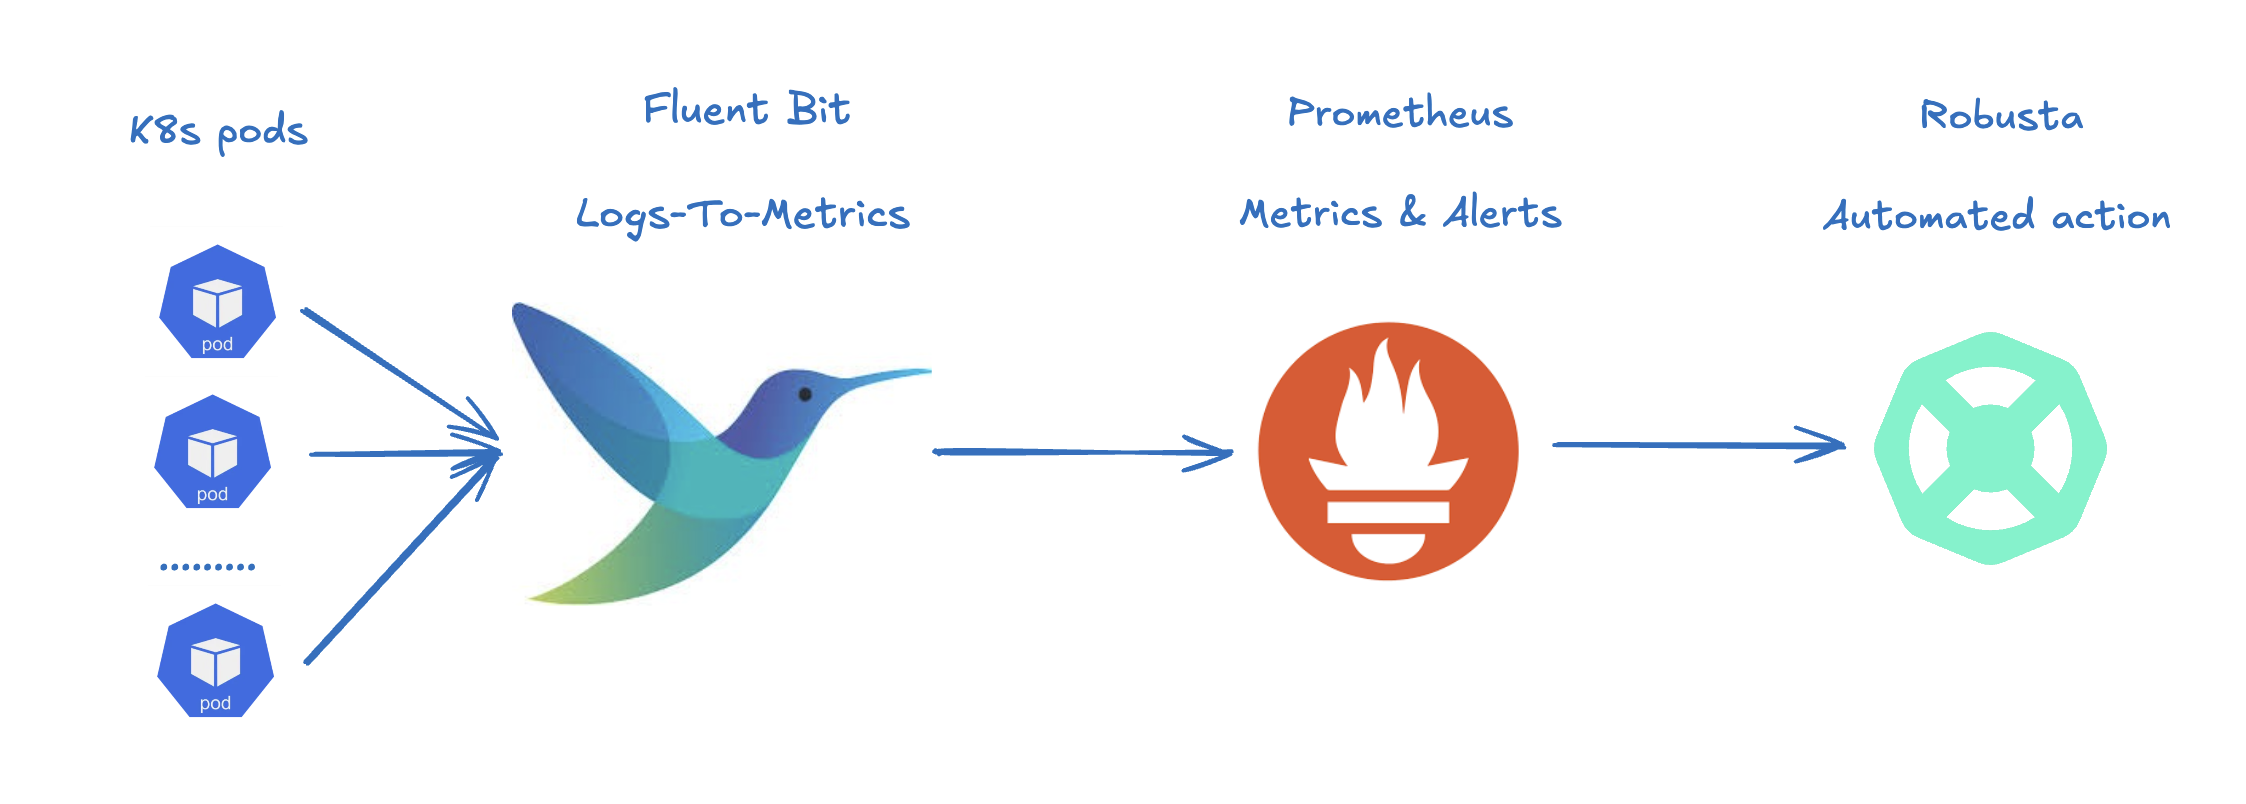
To achieve this, we’ll use:
Fluent Bit: Monitors pod logs and converts matching log lines into Prometheus metrics.
Prometheus: Stores the metrics and triggers alerts based on them. (We're going to use Robusta's bundled Prometheus here, but it can work with any other Prometheus distribution)
Robusta: Executes an automated playbook when an alert is fired, such as restarting the affected pod.
Let's get started! Here's a video explainer of how it works:
Step 1: Create a namespace for the demo
kubectl create namespace log-triggers
kubectl config set-context --current --namespace log-triggers
Step 2: Parse Logs into Metrics with Fluent Bit
First, lets configure Fluent Bit to monitor your pod logs and generate Prometheus metrics for specific log patterns.
We'll configure Fluent Bit as a DaemonSet - there will be a pod on each k8s node
In the example below, we define 2 logs matchers, that create 2 different metrics
We'll use Prometheus exporter, so deliver the metrics to Prometheus
This is our Fluent Bit configuration (fluentbit-values.yaml):
config:
  service: |
    [SERVICE]
        Flush         1
        Daemon        Off
        Log_Level     info
        HTTP_Server   On
        HTTP_Listen   0.0.0.0
        HTTP_Port     2020

  inputs: |
    [INPUT]
        Name              tail
        Tag               kube.*
        Path              /var/log/containers/*.log
        Parser            json_message
        DB                /var/log/flb_kube.db
        Mem_Buf_Limit     5MB
        Skip_Long_Lines   On
        Refresh_Interval  10

    [INPUT]
        Name    dummy
        Tag     dummy.alive
        Dummy   {"log":"keepalive"}

  parsers: |
    [PARSER]
        Name        wrap_raw_line
        Format      regex
        Regex       ^(?<log>.*)$

  filters: |
    [FILTER]
        Name              kubernetes
        Match             kube.*
        K8S-Logging.Parser On
        K8S-Logging.Exclude On

    [FILTER]
        name               log_to_metrics
        match              *
        tag                log_metrics
        metric_mode        counter
        metric_name        mysql_connection_error
        metric_description MySql connection errors
        regex              log .*mysql connection error.*
        add_label          pod $kubernetes['pod_name']
        add_label          namespace $kubernetes['namespace_name']
        add_label          container $kubernetes['container_name']

    [FILTER]
        name               log_to_metrics
        match              *
        tag                log_metrics
        metric_mode        counter
        metric_name        dns_error
        metric_description DNS Resolution errors
        regex              log .*dns error.*
        add_label          pod $kubernetes['pod_name']
        add_label          namespace $kubernetes['namespace_name']
        add_label          container $kubernetes['container_name']

    [FILTER]
        Name               log_to_metrics
        Match              dummy.alive
        Metric_Name        fluentbit_keepalive
        Metric_Description Dummy metric to keep /metrics available
        Metric_Mode        counter
        Tag                log_metrics
        Regex              log .*keepalive.*
        Flush_Interval_Sec 10  # Process and flush metrics every 60 seconds

  outputs: |
    [OUTPUT]
        Name           prometheus_exporter
        Match          log_metrics

    [OUTPUT]
        Name           stdout
        Match          log_metrics

# export metrics
metrics:
  enabled: true

extraPorts:
  - name: metrics
    targetPort: metrics
    protocol: TCP
    port: 2021
    containerPort: 2021

serviceMonitor:
  enabled: true
  additionalEndpoints:
    - port: metrics
      path: /metrics
      honorLabels: true  # important - keep the original label on the metrics (pod, namespace, container)
Note
By default, the
log_to_metricsFILTER, adds thelog_metric_counter_prefix to every metricUnderstanding the Configuration
- The
tailINPUT section defines all Kubernetes container logs as input- The
dummyINPUT section defines a keepalive input - it's required to create at least 1 active metric- The
kubernetesFILTER section is for adding the Kubernetes labels to the log lines/li>- The 1st
log-to-metricsFILTER - match any log line containing "mysql connection error", and increase the ``mysql_connection_error`` counter. Add the pod labels to the metric- The 2nd
log-to-metricsFILTER - match any log line containing "dns error", and increase the ``dns_error`` counter. Add the pod labels to the metric- The 3rd
log-to-metricsFILTER - for the keepalive metric- The
prometheus_exporterOUTPUT is for exporting the Prometheus metrics- The
stdoutOUTPUT is used for debugging. It prints the metrics to the fluentbit pod logs. Not required for production deployment
Let's deploy the Fluent Bit DaemonSet:
helm repo add fluent https://fluent.github.io/helm-charts && helm repo update
helm install metrics-fluent-bit fluent/fluent-bit -f ./fluentbit-values.yaml
Step 3: Configure Prometheus
In this step, we will configure Prometheus to:
Collect metrics from Fluent Bit via a ServiceMonitor
Configure an alert based on the metrics extracted from the logs
1. Configure Prometheus to read the new ServiceMonitor
Assuming you're using Robusta's bundled Prometheus, add this to your generated_values.yaml:
kube-prometheus-stack:
  prometheus:
    prometheusSpec:
      serviceMonitorSelectorNilUsesHelmValues: false
This ensures that Prometheus will read all the service monitors defined in the cluster, not just those installed by the same Helm release (which is the default behavior).
To apply it, upgrade with helm:
helm upgrade robusta robusta/robusta -f generated_values.yaml -set clusterName=YOUR_CLUSTER
2. Configure an Alert
This is the alerting rule that will be used to trigger an alert when a MySqlConnectionErrors is detected in the logs (mysql-alert.yaml):
apiVersion: monitoring.coreos.com/v1
kind: PrometheusRule
metadata:
  labels:
    release: robusta
  name: log-alerting-rule
  namespace: log-triggers
spec:
  groups:
  - name: log-alerting
    rules:
    - alert: MySqlConnectionErrors
      annotations:
        description: 'Pod {{$labels.namespace}}/{{$labels.pod}} logs had {{ printf "%.0f" $value }} MySql connection errors'
        summary: Increase in MySql connection errors in the pod logs
      expr: increase(log_metric_counter_mysql_connection_error[5m]) > 1
      for: 1m
      labels:
        severity: critical
Note
This alert will fire starting from the 2nd time the log line appears - catching the first time is not possible due to how fluentbit works (it only creates the metric after the log appears at least once)
The label
release: robustais required for Robusta's Prometheus to read this alerting rule. Make sure the release name matches the name of your Robusta release
To apply it run:
kubectl apply -f mysql-alert.yaml
Step 4: Adding a Robusta playbook
Now, we'd like to configure an automated action that will run each time this alert is fired.
For that, we'll use a Robusta playbook
This is the playbooks we're going to use (add it as a customPlaybooks section in your generated_values.yaml file):
customPlaybooks:
- triggers:
  - on_prometheus_alert:
      alert_name: MySqlConnectionErrors  # Run when ever the MySqlConnectionErrors alert starts firing
  actions:
  - logs_enricher: {}                    # Add the pod logs to the alert notification
  - delete_pod: {}                       # Delete (restart) the pod the alert was fired on
  - template_enricher:                   # Add a note to the alert notification, that the pod was restarted
      template: "**Automated Action**: Pod **${namespace}/${name}** restarted due to MySQL connection errors"
To apply it, upgrade with helm:
helm upgrade robusta robusta/robusta -f generated_values.yaml -set clusterName=YOUR_CLUSTER
Step 5: See It in Action
Let’s test the full automation pipeline by generating a log line that simulates a MySQL connection error.
1. Deploy a demo pod
Use this manifest to deploy a demo pod that prints to the logs whatever is sent to its API (postlog.yaml):
apiVersion: apps/v1
kind: Deployment
metadata:
  name: postlog1
  namespace: log-triggers
spec:
  replicas: 1
  selector:
    matchLabels:
      app: postlog1
  template:
    metadata:
      labels:
        app: postlog1
    spec:
      containers:
      - name: postlog1
        image: me-west1-docker.pkg.dev/robusta-development/development/postlog:2.0
        ports:
        - containerPort: 8000
        resources:
          requests:
            memory: "128Mi"
            cpu: "50m"
          limits:
            memory: "256Mi"
---
apiVersion: v1
kind: Service
metadata:
  name: postlog1
  namespace: log-triggers
spec:
  selector:
    app: postlog1
  ports:
  - port: 80
    targetPort: 8000
  type: ClusterIP
Apply it to your cluster:
kubectl apply -f postlog.yaml
2. Generate MySQL errors in the logs
Call the pod’s API to print some simulated MySQL errors.
Since the metric has no initial value, we'll call it twice, to simulate an increase. First time with 1 log line:
kubectl run curl --rm -it --image=curlimages/curl --restart=Never -- \
curl -X POST http://postlog1.log-triggers.svc.cluster.local/api/log \
-H "Content-Type: application/json" \
-d '{"content": "mysql connection error", "count": 1}'
Then, after 60 seconds, with 10 log lines:
kubectl run curl --rm -it --image=curlimages/curl --restart=Never -- \
curl -X POST http://postlog1.log-triggers.svc.cluster.local/api/log \
-H "Content-Type: application/json" \
-d '{"content": "mysql connection error", "count": 10}'
This will produce 10 log lines containing the error. Fluent Bit will match the log lines and emit metrics, which Prometheus will collect.
3. Trigger the alert and observe the automation
Wait a few minutes (typically up to 5) for the alert to fire. This delay is due to the for condition in the alert and Prometheus' group_interval.
Once the alert fires, you’ll see the MySqlConnectionErrors alert in:
The Robusta UI (if installed)
Slack, Microsoft Teams, or your configured destination
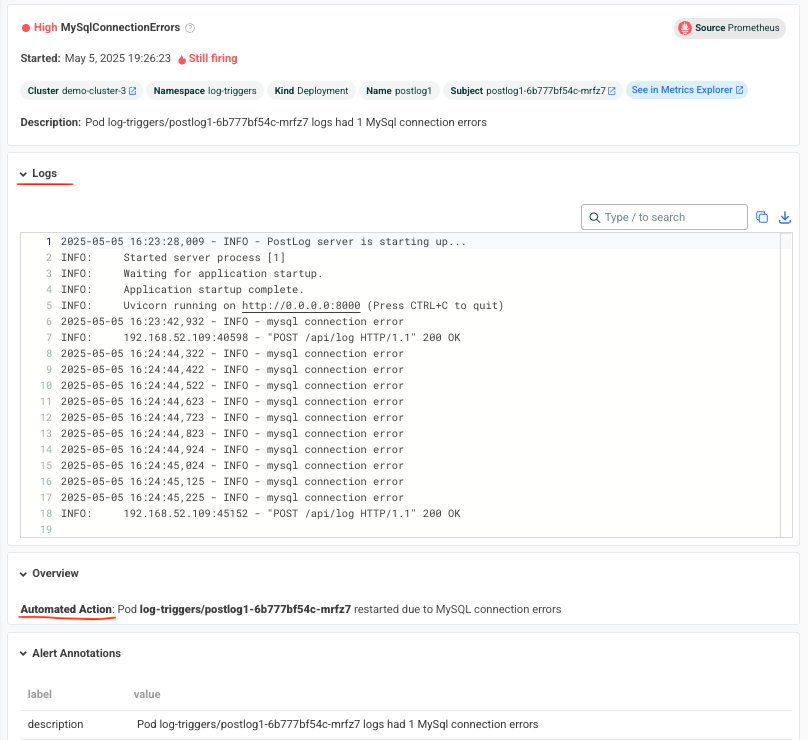
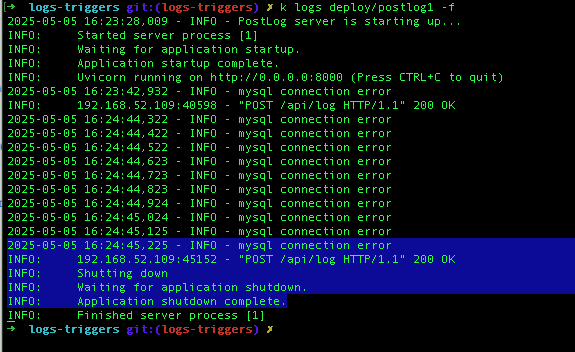
You should also see that the postlog1 pod was restarted:
Note
This example used a restart pod automation, but you can replace it with any other action in Robusta – such as creating a Jira ticket, scaling a deployment, or notifying a human.
🎉 That’s it! You've now built a full pipeline that watches logs, turns them into alerts, and takes automated action.