Getting Support
Ask for help, or just say hi!
Commercial Support
Contact support@robusta.dev for details.
Troubleshooting Guide
Issues are organized by installation phase to help you quickly find solutions.
Quick Diagnosis:
• Phase 1: Helm Installation - Helm install/upgrade failures
• Phase 2: Runtime Issues - Alerts not arriving, pods crashing
• Phase 3: Integration Issues - Slack, Prometheus connection problems
Phase 1: Helm Installation
Problems when running helm install command or installing via GitOps.
unknown field in com.coreos.monitoring.v1.Prometheus.spec, ValidationError(Prometheus.spec)
This indicates potential discrepancies between the version of Prometheus you are trying to use and the version of the CRDs in your cluster.
Follow this guide for upgrading CRDs from an older version.
at least one sink must be defined
Verify sinksConfig is defined in your Robusta values file, with at least one sink like Slack, Teams or Robusta UI ("robusta_sink"). If it's your first time installing, the fastest solution is to start configue creation from scratch.
Error: UPGRADE FAILED: execution error at (robusta/templates/playbooks-config.yaml:9:7): At least one sink must be defined!
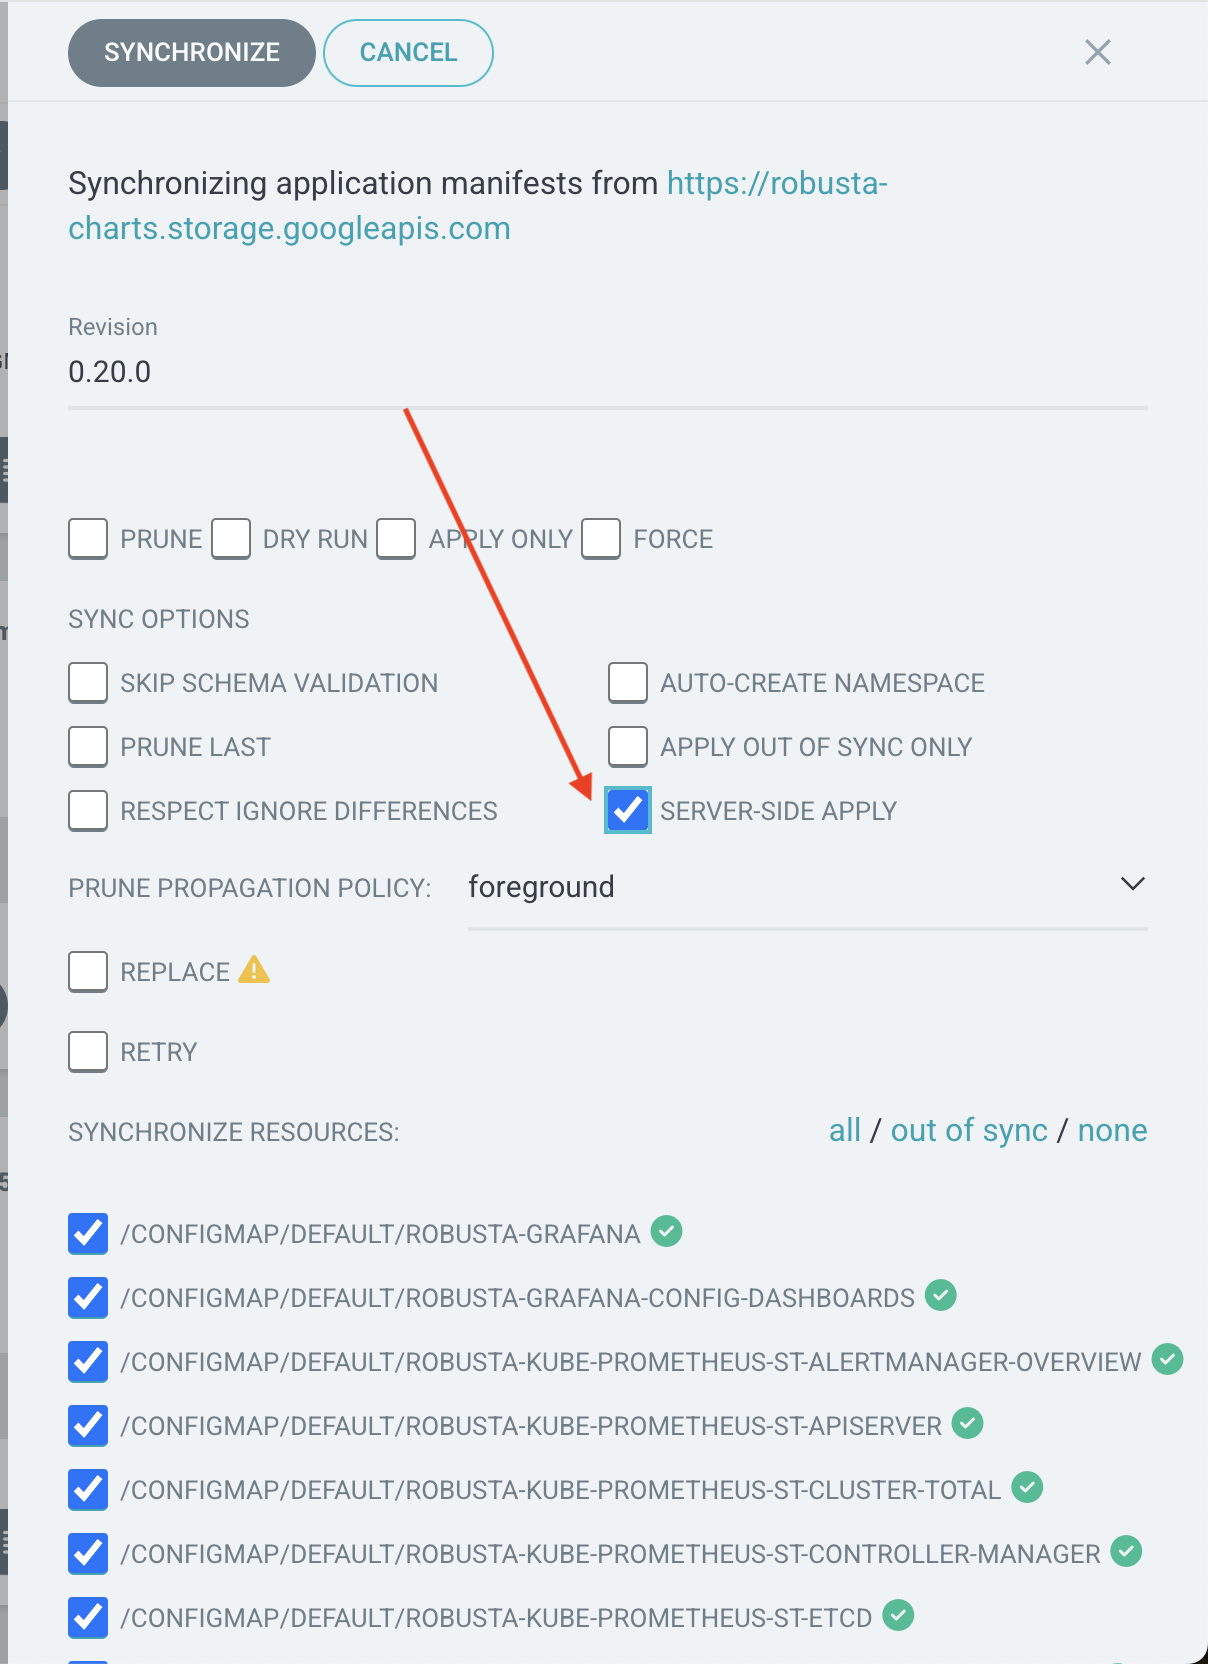
CustomResourceDefinition.apiextensions.k8s.io "prometheuses.monitoring.coreos.com" is invalid: metadata.annotations: Too long
This is often a CRD issue which can be fixed by enabling server-side apply option as shown below. Check out this blog to learn more.

one or more objects failed to apply... CustomResourceDefinition.apiextensions.k8s.io "prometheusagents.monitoring.coreos.com" is invalid
This indicates potential discrepancies between the version of Prometheus you are trying to use and the version of the CRDs in your cluster.
Follow this guide for upgrading CRDs from an older version.
CustomResourceDefinition.apiextensions.k8s.io "prometheuses.monitoring.coreos.com" is invalid
This indicates potential discrepancies between the version of Prometheus you are trying to use and the version of the CRDs in your cluster.
Follow this guide for upgrading CRDs from an older version.
Phase 2: Runtime Issues
Issues after installation when pods are running but not working correctly.
robusta-runner pod issues
robusta-runner pod is in Pending state due to memory issues
If your cluster has 20 Nodes or less, set robusta-runner's memory request to 512MiB in Robusta's Helm values:
runner:
  resources:
    requests:
      memory: 512MiB
    limits:
      memory: 512MiB
robusta-runner isn't working or has exceptions
Start by checking the logs for errors:
kubectl get pods -A | grep robusta-runner # get the name and the namespace of the robusta pod
kubectl logs -n <NAMESPACE> <ROBUSTA-RUNNER-POD-NAME> # get the logs
Discovery Error
2023-04-17 23:37:43.019 ERROR    Discovery process internal error
2023-04-17 23:37:43.022 INFO     Initialized new discovery pool
2023-04-17 23:37:43.022 ERROR    Failed to run publish discovery for robusta_ui_sink
Traceback (most recent call last):
  File "/app/src/robusta/core/sinks/robusta/robusta_sink.py", line 175, in __discover_resources
    results: DiscoveryResults = Discovery.discover_resources()
  File "/app/src/robusta/core/discovery/discovery.py", line 288, in discover_resources
    raise e
  File "/app/src/robusta/core/discovery/discovery.py", line 280, in discover_resources
    return future.result()
  File "/usr/local/lib/python3.9/concurrent/futures/_base.py", line 446, in result
    return self.__get_result()
  File "/usr/local/lib/python3.9/concurrent/futures/_base.py", line 391, in __get_result
    raise self._exception
concurrent.futures.process.BrokenProcessPool: A process in the process pool was terminated abruptly while the future was running or pending.
This error might be due to memory issues. Increase the memory request in Robusta's Helm values:
runner:
  resources:
    requests:
      memory: 2048Mi
    limits:
      memory: 2048Mi
Blocked by firewall / HTTP proxy
If your Kubernetes cluster is behind an HTTP proxy or firewall, follow the instructions in Deploying Behind Proxies to ensure Robusta has the necessary access.
Prometheus issues
Prometheus' pods are in Pending state due to memory issues
If your cluster has 20 Nodes or less, set Prometheus memory request to 1Gi in Robusta's Helm values:
kube-prometheus-stack:
  prometheus:
    prometheusSpec:
      resources:
        requests:
          memory: 1Gi
        limits:
          memory: 1Gi
If using a test cluster like Kind/Colima, re-install Robusta with the isSmallCluster=true property.
If you're also using Robusta's kube-prometheus-stack, add the lines involving prometheusSpec.
helm install robusta robusta/robusta -f ./generated_values.yaml --set clusterName=<YOUR_CLUSTER_NAME> --set isSmallCluster=true \
    --set kube-prometheus-stack.prometheus.prometheusSpec.retentionSize=9GB \
    --set kube-prometheus-stack.prometheus.prometheusSpec.storageSpec.volumeClaimTemplate.spec.resources.requests.storage=10Gi \
    --set kube-prometheus-stack.prometheus.prometheusSpec.resources.requests.memory=512Mi
Holmes
Error in Holmes: binascii.a2b_base64(s, strict_mode=validate)
If the Holmes pod fail to start, with this exception:
2024-09-20 15:37:57.961 INFO     loading config /etc/robusta/config/active_playbooks.yaml
Traceback (most recent call last):
  File "/app/server.py", line 65, in <module>
    dal = SupabaseDal()
          ^^^^^^^^^^^^^
  File "/app/holmes/core/supabase_dal.py", line 38, in __init__
    self.enabled = self.__init_config()
                   ^^^^^^^^^^^^^^^^^^^^
  File "/app/holmes/core/supabase_dal.py", line 68, in __init_config
    robusta_token = self.__load_robusta_config()
                    ^^^^^^^^^^^^^^^^^^^^^^^^^^^^
  File "/app/holmes/core/supabase_dal.py", line 61, in __load_robusta_config
    return RobustaToken(**json.loads(base64.b64decode(token)))
                                     ^^^^^^^^^^^^^^^^^^^^^^^
  File "/usr/local/lib/python3.11/base64.py", line 88, in b64decode
    return binascii.a2b_base64(s, strict_mode=validate)
           ^^^^^^^^^^^^^^^^^^^^^^^^^^^^^^^^^^^^^^^^^^^^
binascii.Error: Invalid base64-encoded string: number of data characters (21) cannot be 1 more than a multiple of 4
It's often because the Robusta UI Token is pulled from a secret, and Holmes cannot read it.
See Using Existing Secrets to configure Holmes to read the token
Phase 3: Integration Issues
Problems with external service integrations after Robusta is running.
Slack Integration
Slack notifications not arriving
Verify Slack webhook URL is correct in your values.yaml
Check robusta-runner logs for Slack-related errors:
kubectl logs -n <NAMESPACE> <ROBUSTA-RUNNER-POD-NAME> | grep -i slack
Test the webhook URL manually using curl
Ensure the Slack app has proper permissions in your workspace
Prometheus Connection Issues
Cannot connect to Prometheus
Verify Prometheus URL in your configuration
Check if Prometheus is accessible from robusta-runner pod:
kubectl exec -n <NAMESPACE> <ROBUSTA-RUNNER-POD-NAME> -- wget -qO- <PROMETHEUS_URL>/api/v1/status/config
For managed Prometheus services, verify authentication tokens and endpoints
Teams/Email Integration
Microsoft Teams or email notifications not working
Verify webhook URLs and authentication credentials
Check for network connectivity issues
Review logs for integration-specific error messages
Alert Manager is not working
Not getting alert manager alerts
Receiver url has namespace TBD
Tip
If you're using the Robusta UI, you can test alert routing by Simulating an alert.
AlertManager Silences are Disappearing
This happens when AlertManager does not have persistent storage enabled.
When using Robusta's embedded Prometheus Stack, persistent storage is enabled by default.
For other Prometheus distributions set the following Helm value (or it's equivalent):
# this is the setting in in kube-prometheus-stack
# the exact setting will differ for other Prometheus distributions
alertmanager:
  alertmanagerSpec:
    storage:
      volumeClaimTemplate:
        spec:
          accessModes: ["ReadWriteOnce"]
          resources:
            requests:
              storage: 10Gi