Cost Savings (KRR)
KRR is a CLI tool that optimizes resource allocation in Kubernetes clusters. It gathers pod usage data from Prometheus and recommends requests and limits for CPU and memory, reducing costs and improving performance.
Robusta can run KRR scans on a schedule using playbooks. Because KRR is so popular, it has dedicated documentation here. You can:
Send weekly scan reports to Slack or other sinks via Robusta OSS (disabled by default, configure below)
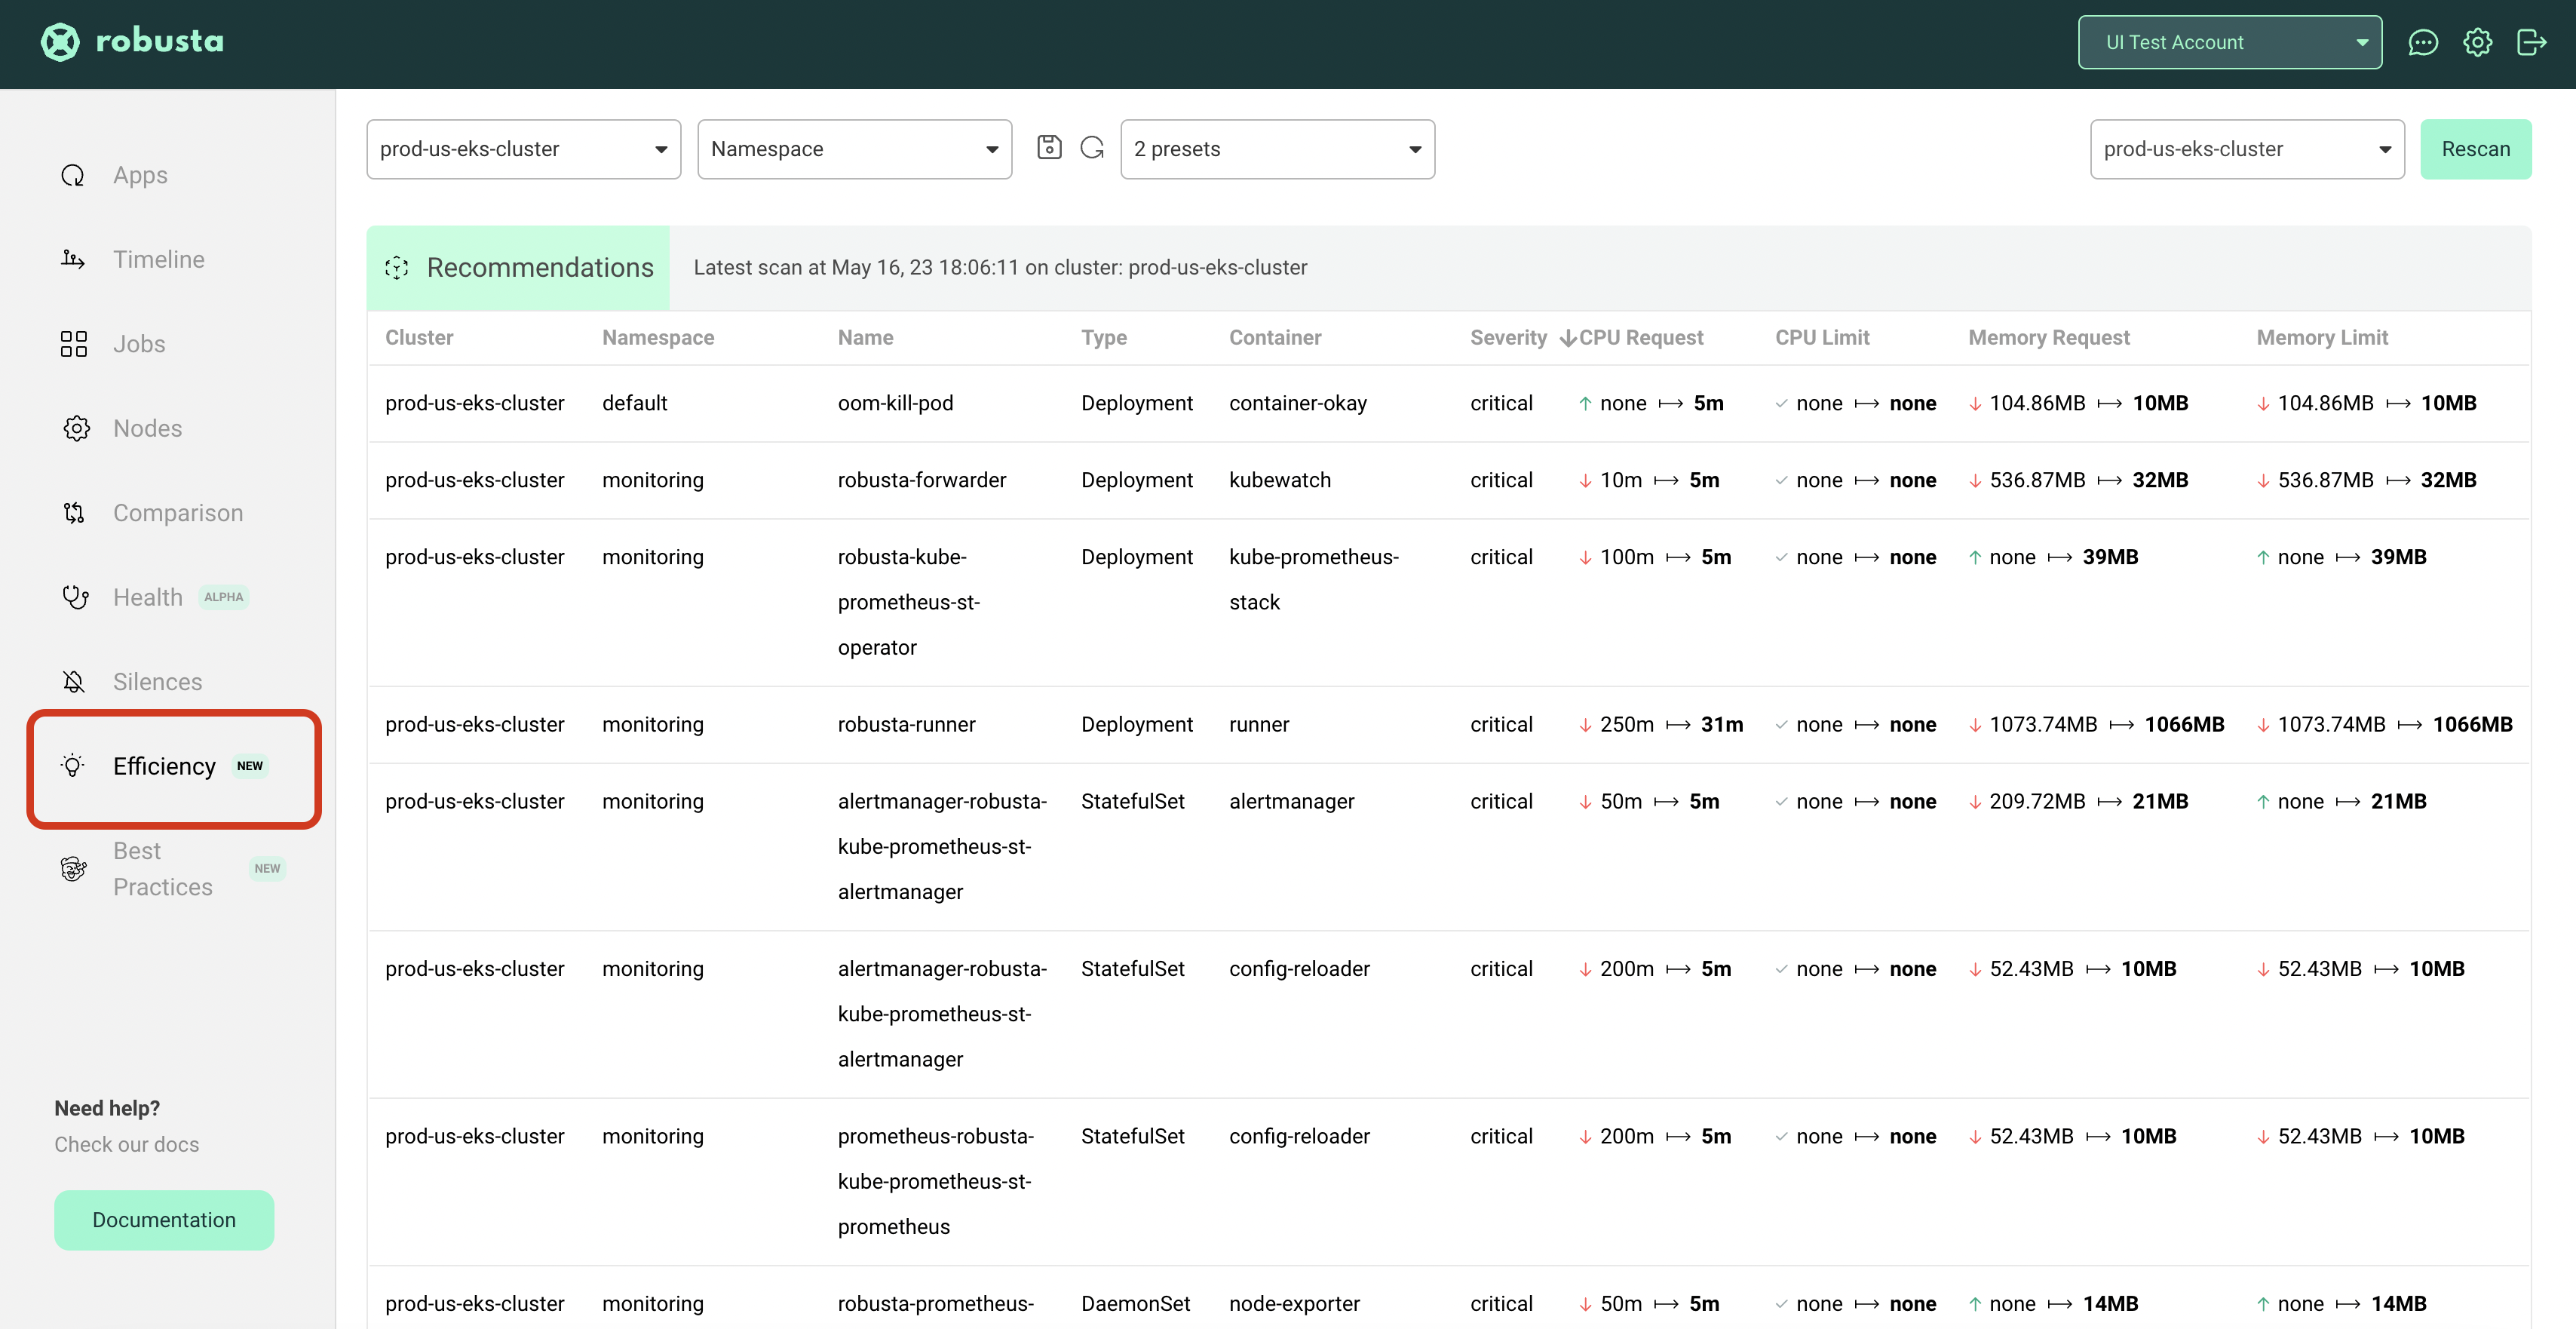
View scans from all your clusters in the Robusta UI (enabled by default for UI users)
Sending Weekly KRR Scan Reports to Slack
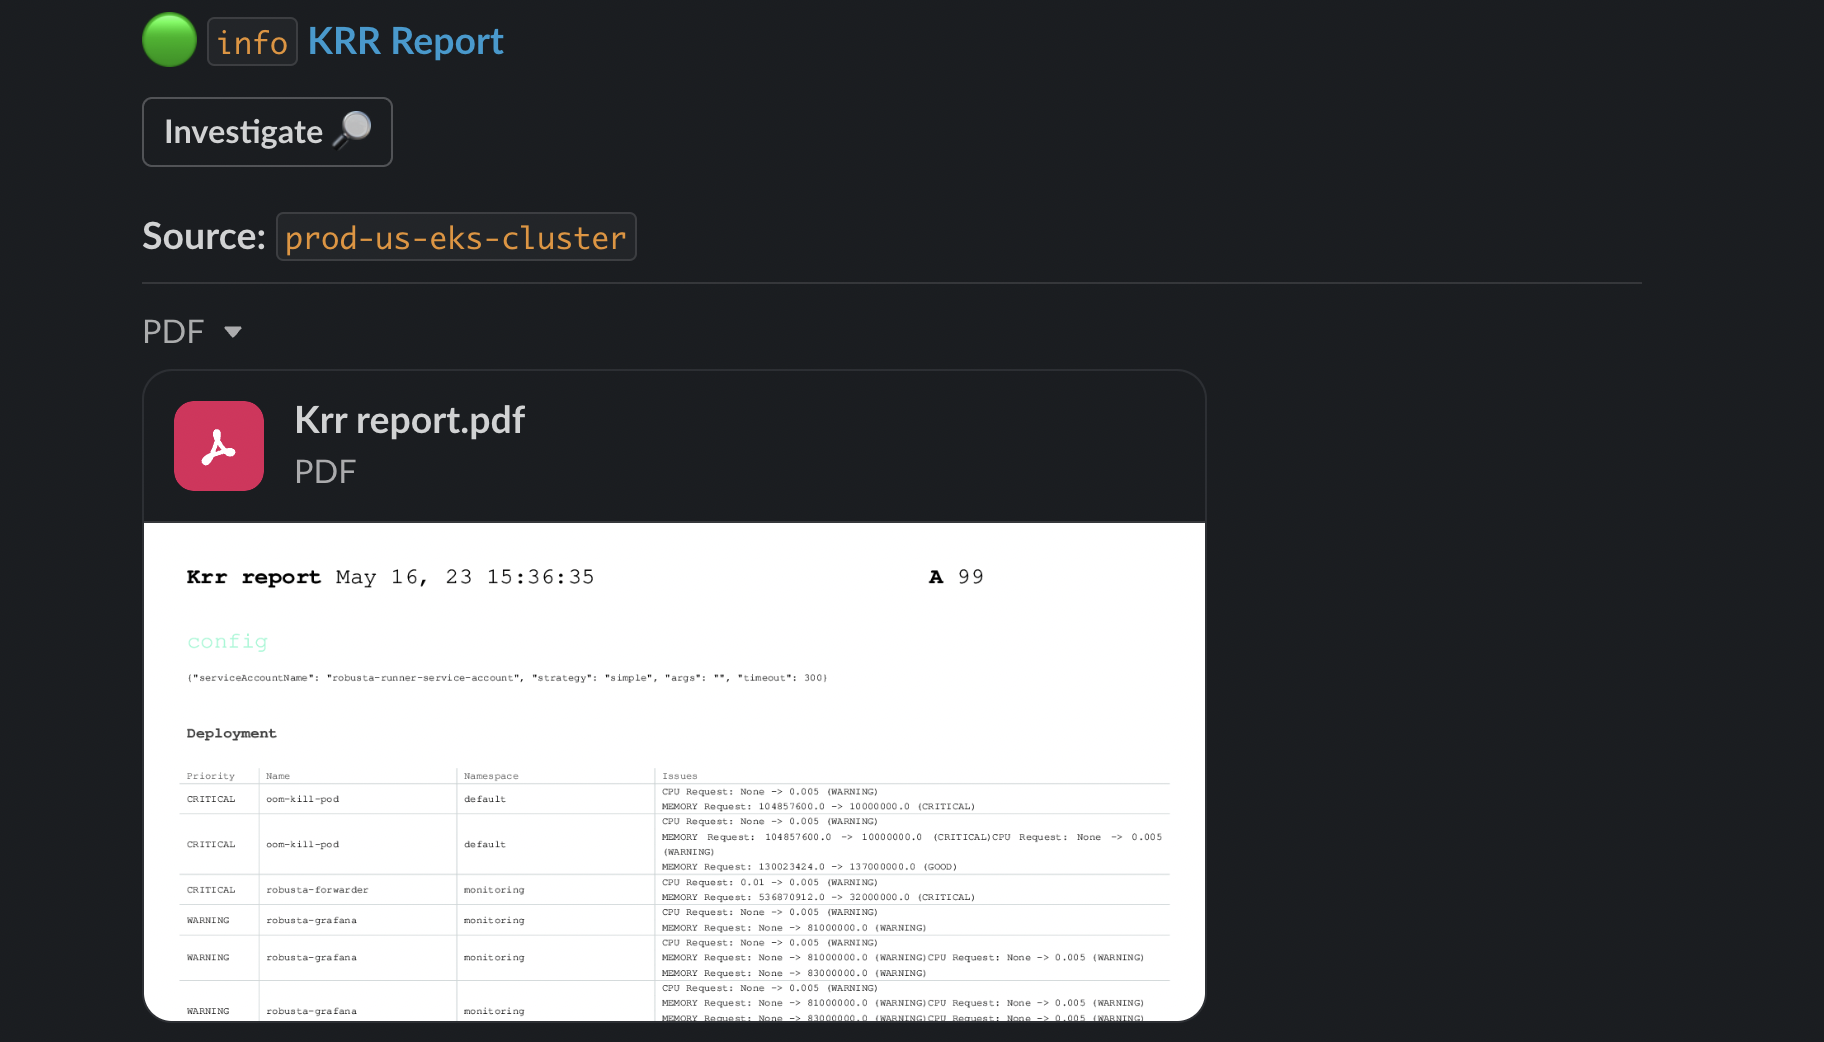
With or without the UI, you can configure additional scans on a schedule. The results can be sent as a PDF to Slack. Follow the steps below to set it up
Install Robusta with Helm to your cluster and configure Slack sink.
Create your KRR slack playbook by adding the following to
generated_values.yaml:
# Runs a weekly krr scan on the namespace devs-namespace and sends it to the configured slack channel
customPlaybooks:
- triggers:
  - on_schedule:
      fixed_delay_repeat:
        repeat: -1 # number of times to run or -1 to run forever
        seconds_delay: 604800 # 1 week
  actions:
  - krr_scan:
      args: "--namespace devs-namespace" ## KRR args here
  sinks:
      - "main_slack_sink" # slack sink you want to send the report to here
Do a Helm upgrade to apply the new values:
helm upgrade robusta robusta/robusta --values=generated_values.yaml --set clusterName=<YOUR_CLUSTER_NAME>
Taints, Tolerations and NodeSelectors
To run KRR on an ARM cluster or on specific nodes you can set custom tolerations or a nodeSelector in your generated_values.yaml file as follows:
globalConfig:
  krr_job_spec:
    tolerations:
    - key: "key1"
      operator: "Exists"
      effect: "NoSchedule"
    nodeSelector:
      nodeName: "your-selector"
Customizing Efficiency Recommendations in the Robusta UI
You can tweak KRR's recommendation algorithm to suit your environment using the krr_args setting in Robusta's Helm chart.
Add the following config to the top of your generated_values.yaml with your custom values. KRR will use these values every time it sends data to the Robusta UI or other destinations.
If you are having performance issues, specifically with Prometheus using a lot of memory, reduce max_workers to reduce memory usage. KRR uses 3 workers by default.
globalConfig:
  krr_args: "--cpu-min 15 --mem-min 200 --cpu_percentile 90 --memory_buffer_percentage 25"
  max_workers: 2
Enabling HPA Recommendations in the Robusta UI
To enable Horizontal Pod Autoscaler (HPA) recommendations in the Robusta UI, add the following to your generated_values.yaml file:
globalConfig:
  krr_args: "--allow-hpa"
Common KRR Settings
|
Type |
Used for |
Default value |
|---|---|---|---|
|
BOOLEAN |
Get recommendations for applications with HPA |
FALSE |
|
INTEGER |
Sets the minimum recommended CPU value in millicores. |
10 |
|
INTEGER |
Sets the minimum recommended memory value in MB. |
100 |
|
TEXT |
The duration of the history data to use (in hours). |
336 |
|
TEXT |
The step for the history data (in minutes). |
1.25 |
|
TEXT |
The percentile to use for the CPU recommendation. |
99 |
|
TEXT |
The percentage of added buffer to the peak memory usage for memory recommendation. |
15 |
|
TEXT |
The number of data points required to make a recommendation for a resource. |
100 |
|
BOOL |
Whether to bump the memory when OOMKills are detected. |
FALSE |
Configuring KRR Job Memory Requests and Limits
To prevent the KRR job from OOMKill (Out of Memory), you can configure the memory requests and limits by adding the following environment variables to your generated_values.yaml file:
runner:
  additional_env_vars:
  - name: KRR_MEMORY_REQUEST
    value: "3Gi"
  - name: KRR_MEMORY_LIMIT
    value: "3Gi"
By default, the memory request and limit are set to 2Gi. Modify these values according to your requirements.
Enable KRR security context
To enable KRR security context, add the following to your generated_values.yaml file:
runner:
  setKRRSecurityContext: true
KRR API
You can retrieve KRR recommendations programmatically using the Robusta API. This allows you to integrate resource recommendations into your own tools and workflows.
Authentication
The KRR API requires authentication via API key.
To create your key, on the Robusta Platform, go to the settings page, and choose the API keys tab.
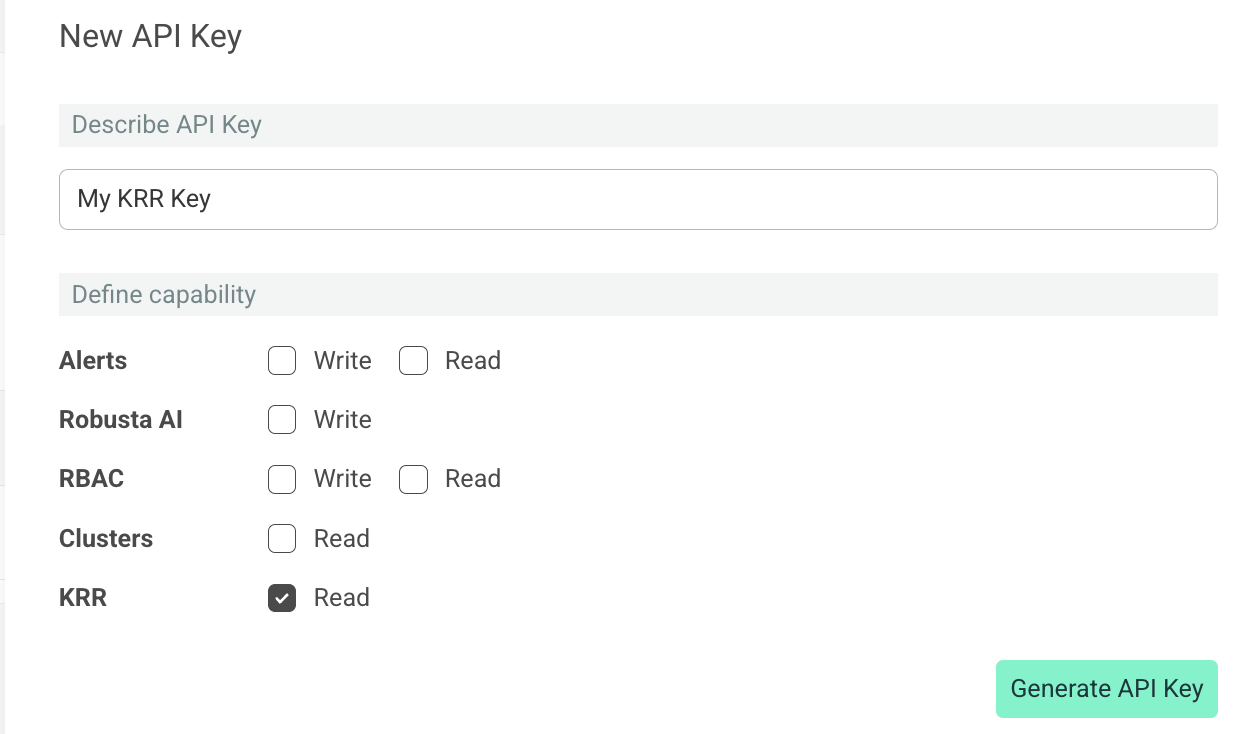
Click New API Key. Choose a name for your key, and check the KRR Read capability.

GET /api/krr/recommendations
Retrieves KRR resource recommendations for a specific cluster and namespace.
Query Parameters
Parameter |
Type |
Description |
Required |
|---|---|---|---|
|
STRING |
The account ID associated with the API key |
Yes |
|
STRING |
The cluster ID to get recommendations for |
Yes |
|
STRING |
The namespace to filter recommendations (optional) |
No |
Request Headers
Header |
Value |
|---|---|
|
|
|
|
Example Request
curl -X GET "https://api.robusta.dev/api/krr/recommendations?account_id=YOUR_ACCOUNT_ID&cluster_id=my-cluster&namespace=default" \
  -H "Authorization: Bearer YOUR_API_KEY" \
  -H "Content-Type: application/json"
Success Response (200 OK)
{
  "cluster_id": "my-cluster",
  "scan_id": "12345-67890-abcde",
  "scan_date": "2024-01-07T12:00:00Z",
  "scan_state": "success",
  "results": [
    {
      "cluster_id": "my-cluster",
      "namespace": "default",
      "name": "nginx-deployment",
      "kind": "Deployment",
      "container": "nginx",
      "priority": "MEDIUM",
      "current_cpu_request": 100,
      "recommended_cpu_request": 50,
      "current_cpu_limit": 500,
      "recommended_cpu_limit": 200,
      "current_memory_request": 134217728,
      "recommended_memory_request": 67108864,
      "current_memory_limit": 536870912,
      "recommended_memory_limit": 268435456,
      "pods_count": 3
    }
  ]
}
Response Fields
Field |
Type |
Description |
|---|---|---|
|
STRING |
The cluster ID for which recommendations were generated |
|
STRING |
Unique identifier for this KRR scan |
|
STRING |
Timestamp when the scan was completed (ISO 8601 format) |
|
STRING |
State of the scan (e.g., "success") |
|
ARRAY |
Array of KRR recommendations for workloads |
|
STRING |
Cluster ID of the workload |
|
STRING |
Namespace of the workload |
|
STRING |
Name of the Kubernetes workload |
|
STRING |
Type of Kubernetes resource (Deployment, StatefulSet, etc.) |
|
STRING |
Container name within the workload |
|
STRING |
Priority level of the recommendation |
|
NUMBER |
Current CPU request in millicores |
|
NUMBER |
Recommended CPU request in millicores |
|
NUMBER |
Current CPU limit in millicores |
|
NUMBER |
Recommended CPU limit in millicores |
|
NUMBER |
Current memory request in bytes |
|
NUMBER |
Recommended memory request in bytes |
|
NUMBER |
Current memory limit in bytes |
|
NUMBER |
Recommended memory limit in bytes |
|
INTEGER |
Number of pods for this workload |
Error Responses
401 Unauthorized
{
  "error": "Invalid or missing API key"
}
400 Bad Request
{
  "msg": "Bad query parameters [error details]",
  "error_code": "BAD_PARAMETER"
}
500 Internal Server Error
{
  "msg": "Failed to query KRR recommendations",
  "error_code": "UNEXPECTED_ERROR"
}
Reference
Krr scan
Playbook Action: krr_scan
Displays a KRR scan report.
You can trigger a KRR scan at any time, by running the following command:
robusta playbooks trigger krr_scan
Add this to your Robusta configuration (Helm values.yaml):
customPlaybooks:
- actions:
  - krr_scan:
      prometheus_additional_labels: 'cluster: ''cluster-2-test''env: ''prod'''
      prometheus_auth: Basic YWRtaW46cGFzc3dvcmQ=
      prometheus_url: http://prometheus-k8s.monitoring.svc.cluster.local:9090
      prometheus_url_query_string: demo-query=example-data
  triggers:
  - on_schedule: {}
The above is an example. Try customizing the trigger and parameters.
- custom_annotations (str dict)
custom annotations to be used for the running pod/job
- prometheus_url (str)
Prometheus url. If omitted, we will try to find a prometheus instance in the same cluster
- prometheus_auth (str)
Prometheus auth header to be used in Authorization header. If omitted, we will not add any auth header
- prometheus_url_query_string (str)
Additional query string parameters to be appended to the Prometheus connection URL
- prometheus_additional_headers (str dict)
additional HTTP headers (if defined) to add to every prometheus query
- prometheus_additional_labels (str dict)
A dictionary of additional labels needed for multi-cluster prometheus
- add_additional_labels (bool) = True
adds the additional labels (if defined) to the query
- prometheus_graphs_overrides (complex list)
each entry contains:
required:- resource_type (str)
- item_type (str)
- query (str)
- values_format (str)
- serviceAccountName (str) = robusta-runner-service-account
The account name to use for the KRR scan job.
- strategy (str) = simple
- args (str)
Deprecated - KRR cli arguments.
- krr_args (str)
KRR cli arguments.
- timeout (int) = 3600
Time span for yielding the scan.
- max_workers (int) = 3
Number of concurrent workers used in krr.
- krr_verbose (bool)
Run krr job with verbose logging
- krr_job_spec (dict)
A dictionary for passing spec params such as tolerations and nodeSelector.
This action can be manually triggered using the Robusta CLI:
robusta playbooks trigger krr_scan

