Insights Coverage
Robusta's monitors these alerts and errors by default. It finds insights and suggests fixes.
Warning
This page is under construction! Current contents are incomplete.
Prometheus Alerts
CPUThrottlingHigh - show the reason and how to fix it
HostOomKillDetected - show which pods were killed
KubeNodeNotReady - show node resources and effected pods
HostHighCpuLoad - show CPU usage analysis
KubernetesDaemonsetMisscheduled - flag known false positives and suggest fixes
KubernetesDeploymentReplicasMismatch - show the deployment's status
NodeFilesystemSpaceFillingUp - show disk usage
Warning
You must send your Prometheus alerts to Robusta by webhook for these to work. See AlertManager Integration.
Other errors
These are identified by listening to the API Server:
CrashLoopBackOff
ImagePullBackOff
Node NotReady
Additionally, all Kubernetes Events (kubectl get events) of WARNING level and above are sent to the Robusta UI.
Change Tracking
By default all changes to Deployments, DaemonSets, and StatefulSets are sent to the Robusta UI for correlation with Prometheus alerts and other errors.
These changes are not sent to other sinks (e.g. Slack) by default because they are spammy. See Notification Routing to learn how to selectively track changes you care about in Slack as well.
We also wrote a blog post Why everyone should track Kubernetes changes and top four ways to do so
Optional add-ons
These have the potential to be spammy so they aren't enabled by default.
We will enable them once we finish the fine-tuning. Until them, you can enable them yourself.
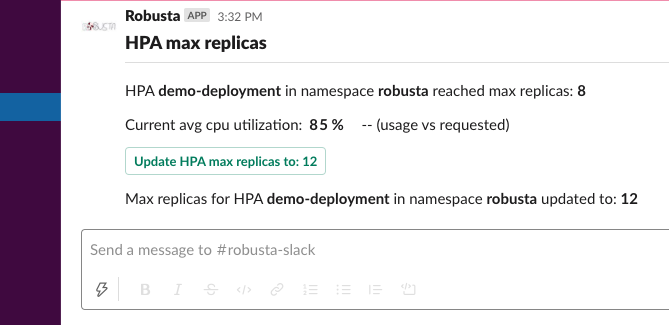
Alert on hpa reached limit
Playbook Action: alert_on_hpa_reached_limit
Add this to your Robusta configuration (Helm values.yaml):
customPlaybooks:
- actions:
  - alert_on_hpa_reached_limit: {}
  triggers:
  - on_horizontalpodautoscaler_create: {}
The above is an example. Try customizing the trigger and parameters.
- increase_pct (int) = 20
Increase the HPA max_replicas by this percentage.
