Warning
This is a legacy feature. For new integrations, please use the Send Events API instead.
Embedded Prometheus Stack
Robusta can install an embedded Prometheus stack with pre-configured alerts.
It includes defaults alerts that we fine-tuned in advance, as well as prebuilt Robusta playbooks.
This option is highly recommended, but disabled by default, as many users already have Prometheus installed.
To customize the bundled kube-prometheus-stack, explore the chart values.yaml file.
Enabling the Embedded Prometheus
Add to generated_values.yaml:
enablePrometheusStack: true
Apply the change by performing a Helm Upgrade.
Change the retention period
By default, Prometheus stores data for 14-15 days.
You can modify retention times in generated_values.yaml:
prometheus:
  prometheusSpec:
    retention: 15d #change the number of days here
Apply the change by performing a Helm Upgrade.
Grafana Persistent Data
To allow the Grafana dashboard to persist after the Grafana instance restarts, you could add to generated_values.yaml:
...
# Customize settings
kube-prometheus-stack:
  grafana:
    persistence:
      enabled: true
Apply the change by performing a Helm Upgrade.
Creating Custom Prometheus Alerts
Prometheus Alerts are defined on Kubernetes using the PrometheusRule CRD.
Prerequisites
Enable global rule selection for the Prometheus operator. Add the following config to your generated_values.yaml. (By default Prometheus Operator picks up only certain new alerts, here we tell it to pick up all new alerts)
kube-prometheus-stack:
  prometheus:
    prometheusSpec:
      ruleNamespaceSelector: {} # (1)
      ruleSelector: {} # (2)
      ruleSelectorNilUsesHelmValues: false # (3)
Add a namespace if you want Prometheus to identify rules created in specific namespaces. Leave
{}to detect rules from any namespace.Add a label if you want Prometheus to detect rules with a specific selector. Leave
{}to detect rules with any label.When set to false, Prometheus detects rules that are created directly, not just rules created using helm values file.
Defining an Alert
As an example, we'll define an alert to find Pods with CPU usage over their request.
Save the following YAML into my_alert.yaml and run kubectl apply -f my_alert.yaml
apiVersion: monitoring.coreos.com/v1
kind: PrometheusRule
metadata:
  name: container-cpu-alert
  labels:
    prometheus: kube-prometheus
    role: alert-rules
spec:
  groups:
    - name: container-cpu-usage
      rules:
        - alert: KubeContainerCPURequestAlert
          expr: |
            (rate(container_cpu_usage_seconds_total{container="stress"}[5m]) /
            on (container) kube_pod_container_resource_requests{resource="cpu", container="stress"}) > 0.75
          for: 1m
          labels:
            severity: warning
          annotations:
            summary: "Container CPU usage is above 75% of request for 5 minutes"
            description: "The container is using more than 75% of its requested CPU for 5 minutes."
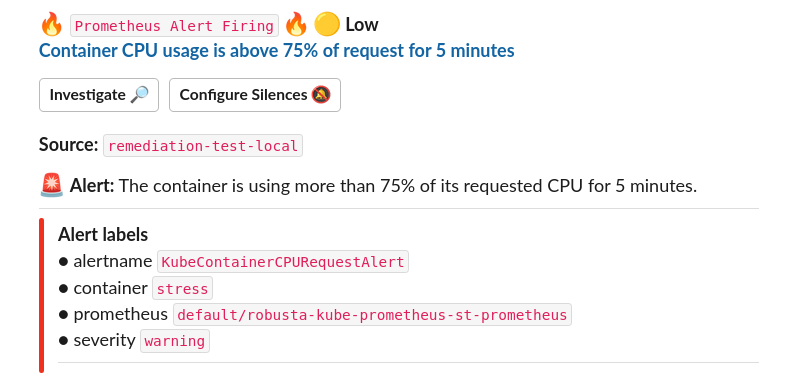
Testing the Alert
To test the alert, deploy a pod that uses more CPU than its request.
kubectl apply -f https://raw.githubusercontent.com/robusta-dev/kubernetes-demos/main/cpu_throttling/throttling.yaml
You will know the alert was defined successfully when Prometheus fires an alert and you receive a notification in all configured sinks.
Troubleshooting
Encountering issues with your Prometheus? Follow this guide to resolve some common errors.