Warning
This is a legacy feature. For new integrations, please use the Send Events API instead.
AlertManager - external
Follow this guide to connect Robusta to a central Prometheus (e.g. Thanos/Mimir), running outside the cluster monitored by Robusta.
Note
Using Grafana Cloud? For Grafana Cloud with Mimir, see the dedicated guide: Grafana Cloud
You will need to configure two integrations: one to send alerts to Robusta and another to let Robusta query metrics and create silences.
Send Alerts to Robusta
This integration lets your central Prometheus send alerts to Robusta, as if they were in the same cluster:
Verify that all alerts contain a label named
cluster_nameorcluster, matching the cluster_name defined in Robusta's configuration. This is necessary to identify which robusta-runner should receive alerts.Edit the configuration for your centralized AlertManager:
alertmanager.yaml
receivers:
  - name: 'robusta'
    webhook_configs:
      - url: 'https://api.robusta.dev/integrations/generic/alertmanager'
        http_config:
          authorization:
            # Replace <TOKEN> with a string in the format `<ACCOUNT_ID> <SIGNING_KEY>`
            credentials: <TOKEN>
        send_resolved: true # (3)

route: # (1)
  routes:
  - receiver: 'robusta'
    group_by: [ '...' ]
    group_wait: 1s
    group_interval: 1s
    matchers:
      - severity =~ ".*"
    repeat_interval: 4h
    continue: true # (2)
Make sure the Robusta
routeis the firstroutedefined. If it isn't the first route, it might not receive alerts. When arouteis matched, the alert will not be sent to following routes, unless therouteis configured withcontinue: true.Ensures that alerts continue to be sent even after a match is found
Enables sending resolved alerts to Robusta
Verify it Works
Send a dummy alert to AlertManager:
If you have the Robusta CLI installed, you can send a test alert using the following command:
robusta demo-alert
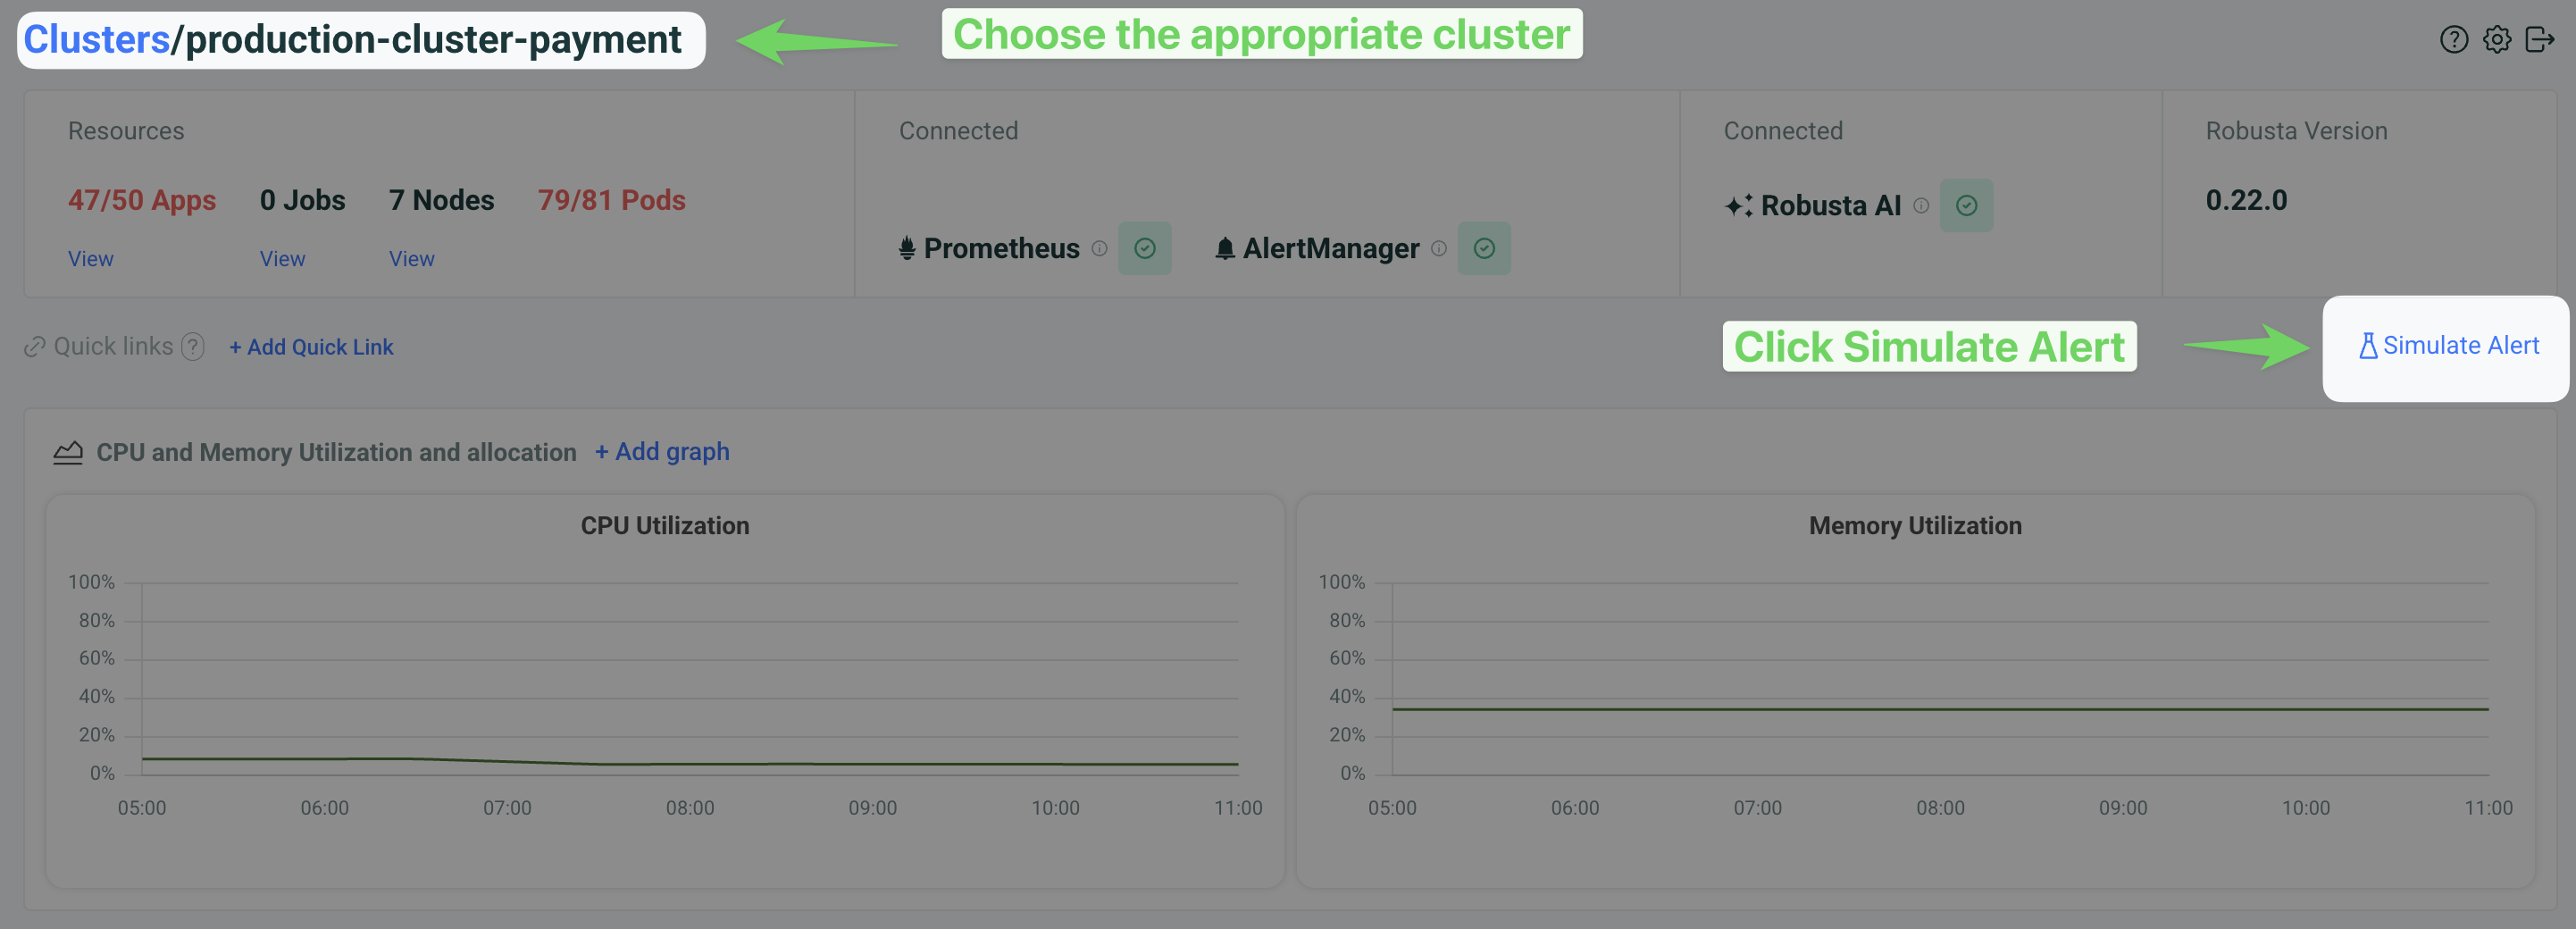
In the Robusta UI, go to the "Clusters" tab, choose the right cluster and click "Simulate Alert".
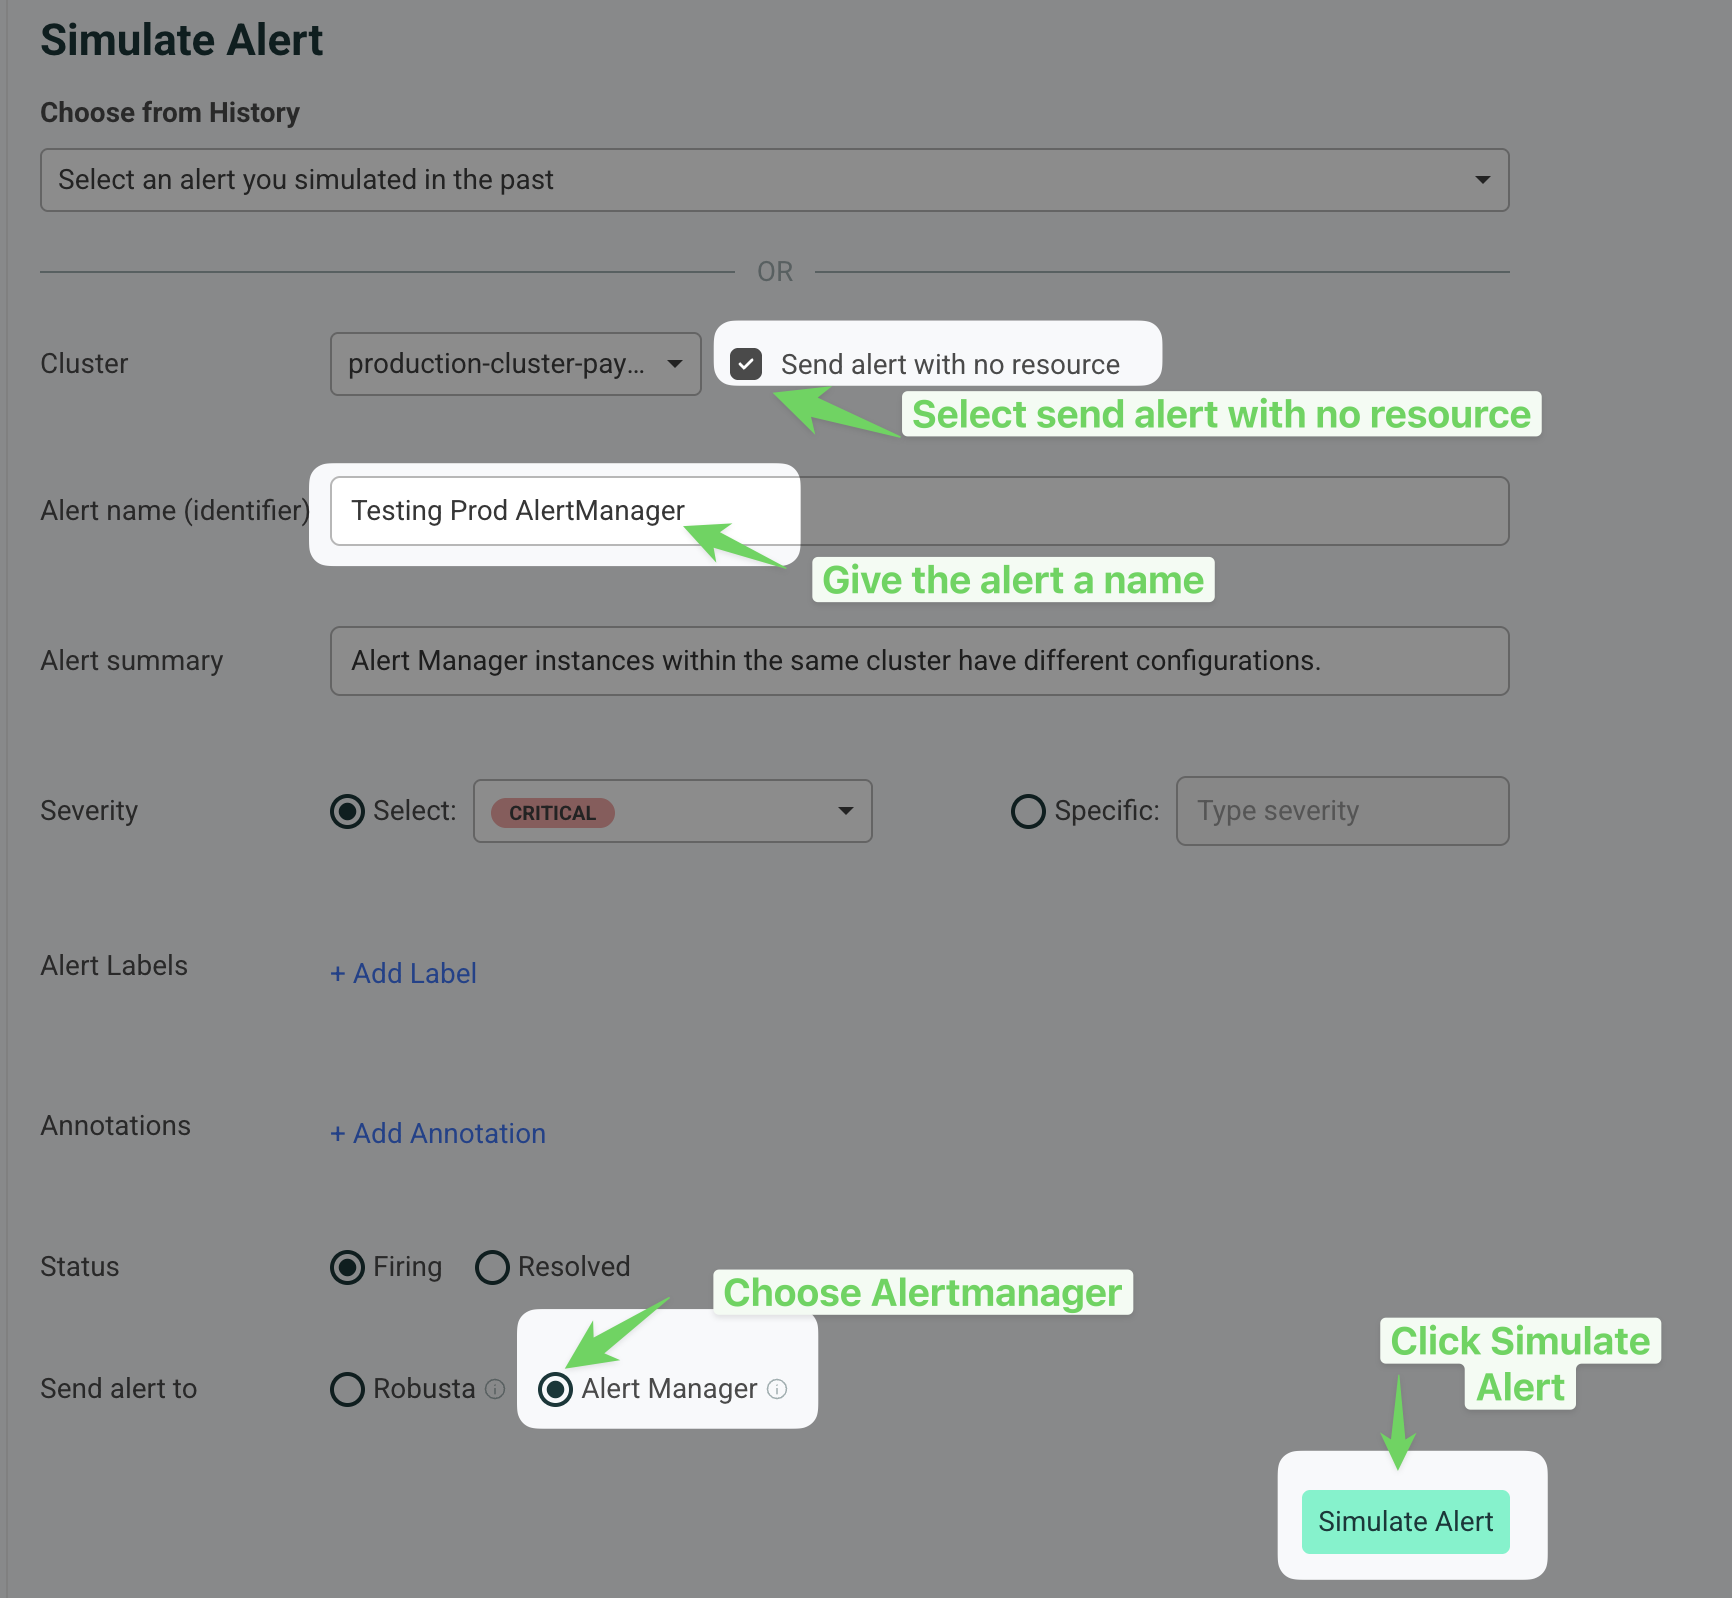
Then
Check Send alert with no resource.
Provide a name for the alert in the Alert name (identifier) field (e.g., "Testing Prod AlertManager").
Select Alert Manager under the "Send alert to" section.
Click the Simulate Alert button to send the test alert.
If everything is setup properly, this alert will reach Robusta. It will show up in the Robusta UI, Slack, and other configured sinks.
Note
It might take a few minutes for the alert to arrive due to AlertManager's group_wait and group_interval settings. More info here.
I configured AlertManager, but I'm not receiving alerts?
Try sending a demo-alert as described above. If nothing arrives, check:
AlertManager UI status page - verify that your config was picked up
kube-prometheus-operator logs (if relevant)
AlertManager logs
Reach out on Slack for assistance.
Robusta isn't mapping alerts to Kubernetes resources
Robusta enriches alerts with Kubernetes and log data using Prometheus labels for mapping. Standard label names are used by default. If your setup differs, you can customize this mapping to fit your environment.
Send Alerts to Robusta with API Key
If you are using a third-party AlertManager and want to give it separate credentials (instead of using the signing key from generated_values.yaml), you can create a dedicated API key in the Robusta UI.
Note
This feature is available with the Robusta SaaS platform and self-hosted commercial plans. It is not available in the open-source version.
Verify that all alerts contain a label named
cluster_nameorcluster, matching the cluster_name defined in Robusta's configuration. This is necessary to identify which robusta-runner should receive alerts.In the Robusta UI, go to Settings → API Keys.
Click New API Key, select Alerts: Write permissions, and Save.
Copy the generated API key.
Find your
account_id:In your generated_values.yaml file (from installation), or
In the Robusta UI under Settings → Workspace.
Edit the configuration for your AlertManager, using the API key in place of the signing key:
alertmanager.yaml
receivers:
  - name: 'robusta'
    webhook_configs:
      - url: 'https://api.robusta.dev/integrations/generic/alertmanager'
        http_config:
          authorization:
            # Replace <ACCOUNT_ID> with your Robusta account ID
            # Replace <API_KEY> with the API key you created above
            credentials: '<ACCOUNT_ID> <API_KEY>'
        send_resolved: true

route:
  routes:
  - receiver: 'robusta'
    group_by: [ '...' ]
    group_wait: 1s
    group_interval: 1s
    matchers:
      - severity =~ ".*"
    repeat_interval: 4h
    continue: true
Verify it Works
Send a dummy alert to AlertManager:
If you have the Robusta CLI installed, you can send a test alert using the following command:
robusta demo-alert
In the Robusta UI, go to the "Clusters" tab, choose the right cluster and click "Simulate Alert".
Then
Check Send alert with no resource.
Provide a name for the alert in the Alert name (identifier) field (e.g., "Testing Prod AlertManager").
Select Alert Manager under the "Send alert to" section.
Click the Simulate Alert button to send the test alert.
If everything is setup properly, this alert will reach Robusta. It will show up in the Robusta UI, Slack, and other configured sinks.
Note
It might take a few minutes for the alert to arrive due to AlertManager's group_wait and group_interval settings. More info here.
I configured AlertManager, but I'm not receiving alerts?
Try sending a demo-alert as described above. If nothing arrives, check:
AlertManager UI status page - verify that your config was picked up
kube-prometheus-operator logs (if relevant)
AlertManager logs
Reach out on Slack for assistance.
Robusta isn't mapping alerts to Kubernetes resources
Robusta enriches alerts with Kubernetes and log data using Prometheus labels for mapping. Standard label names are used by default. If your setup differs, you can customize this mapping to fit your environment.
Configure Metric Querying
To enable Robusta to pull metrics and create silences, you need to configure Prometheus and AlertManager URLs.
See Prometheus and metrics configuration for detailed instructions.
Note
Robusta will attempt to auto-detect Prometheus and AlertManager URLs in your cluster. Manual configuration is only needed if auto-detection fails.
Filtering Prometheus Queries by Cluster
If the same external Prometheus is used for many clusters, you will want to add a cluster name to all queries.
You can do so with the prometheus_url_query_string parameter, shown below:
globalConfig:
  # Additional query string parameters to be appended to the Prometheus connection URL (optional)
  prometheus_url_query_string: "cluster=prod1&x=y"