Warning
This is a legacy feature. For new integrations, please use the Send Events API instead.
AlertManager - in-cluster
This guide shows how to send alerts from an existing AlertManager to Robusta in the same cluster.
If your AlertManager is in a different cluster, refer to AlertManager - external.
Send Alerts to Robusta
Configure your AlertManager to send alerts to Robusta:
Add the following to your AlertManager's config Secret.
Do not apply in other ways, they all have limitations and won't forward all alerts.
receivers:
  - name: 'robusta'
    webhook_configs:
      - url: 'http://<helm-release-name>-runner.<namespace>.svc.cluster.local/api/alerts'
        send_resolved: true # (3)
  - name: 'default-receiver'

route: # (1)
  routes:
    - receiver: 'robusta'
      group_by: [ '...' ]
      group_wait: 1s
      group_interval: 1s
      matchers:
        - severity =~ ".*"
      repeat_interval: 4h
      continue: true # (2)
  receiver: 'default-receiver'
Put Robusta's route as the first route, to guarantee it receives alerts. If you can't do so, you must guarantee all previous routes set
continue: true.Keep sending alerts to receivers defined after Robusta.
Important, so Robusta knows when alerts are resolved.
Add the following to your AlertManager configuration, wherever it is defined.
receivers:
  - name: 'robusta'
    webhook_configs:
      - url: 'http://<helm-release-name>-runner.<namespace>.svc.cluster.local/api/alerts'
        send_resolved: true # (3)

route: # (1)
  routes:
    - receiver: 'robusta'
      group_by: [ '...' ]
      group_wait: 1s
      group_interval: 1s
      matchers:
        - severity =~ ".*"
      repeat_interval: 4h
      continue: true # (2)
Put Robusta's route as the first route, to guarantee it receives alerts. If you can't do so, you must guarantee all previous routes set
continue: true.Keep sending alerts to receivers defined after Robusta.
Important, so Robusta knows when alerts are resolved.
Verify it Works
Send a dummy alert to AlertManager:
If you have the Robusta CLI installed, you can send a test alert using the following command:
robusta demo-alert
In the Robusta UI, go to the "Clusters" tab, choose the right cluster and click "Simulate Alert".
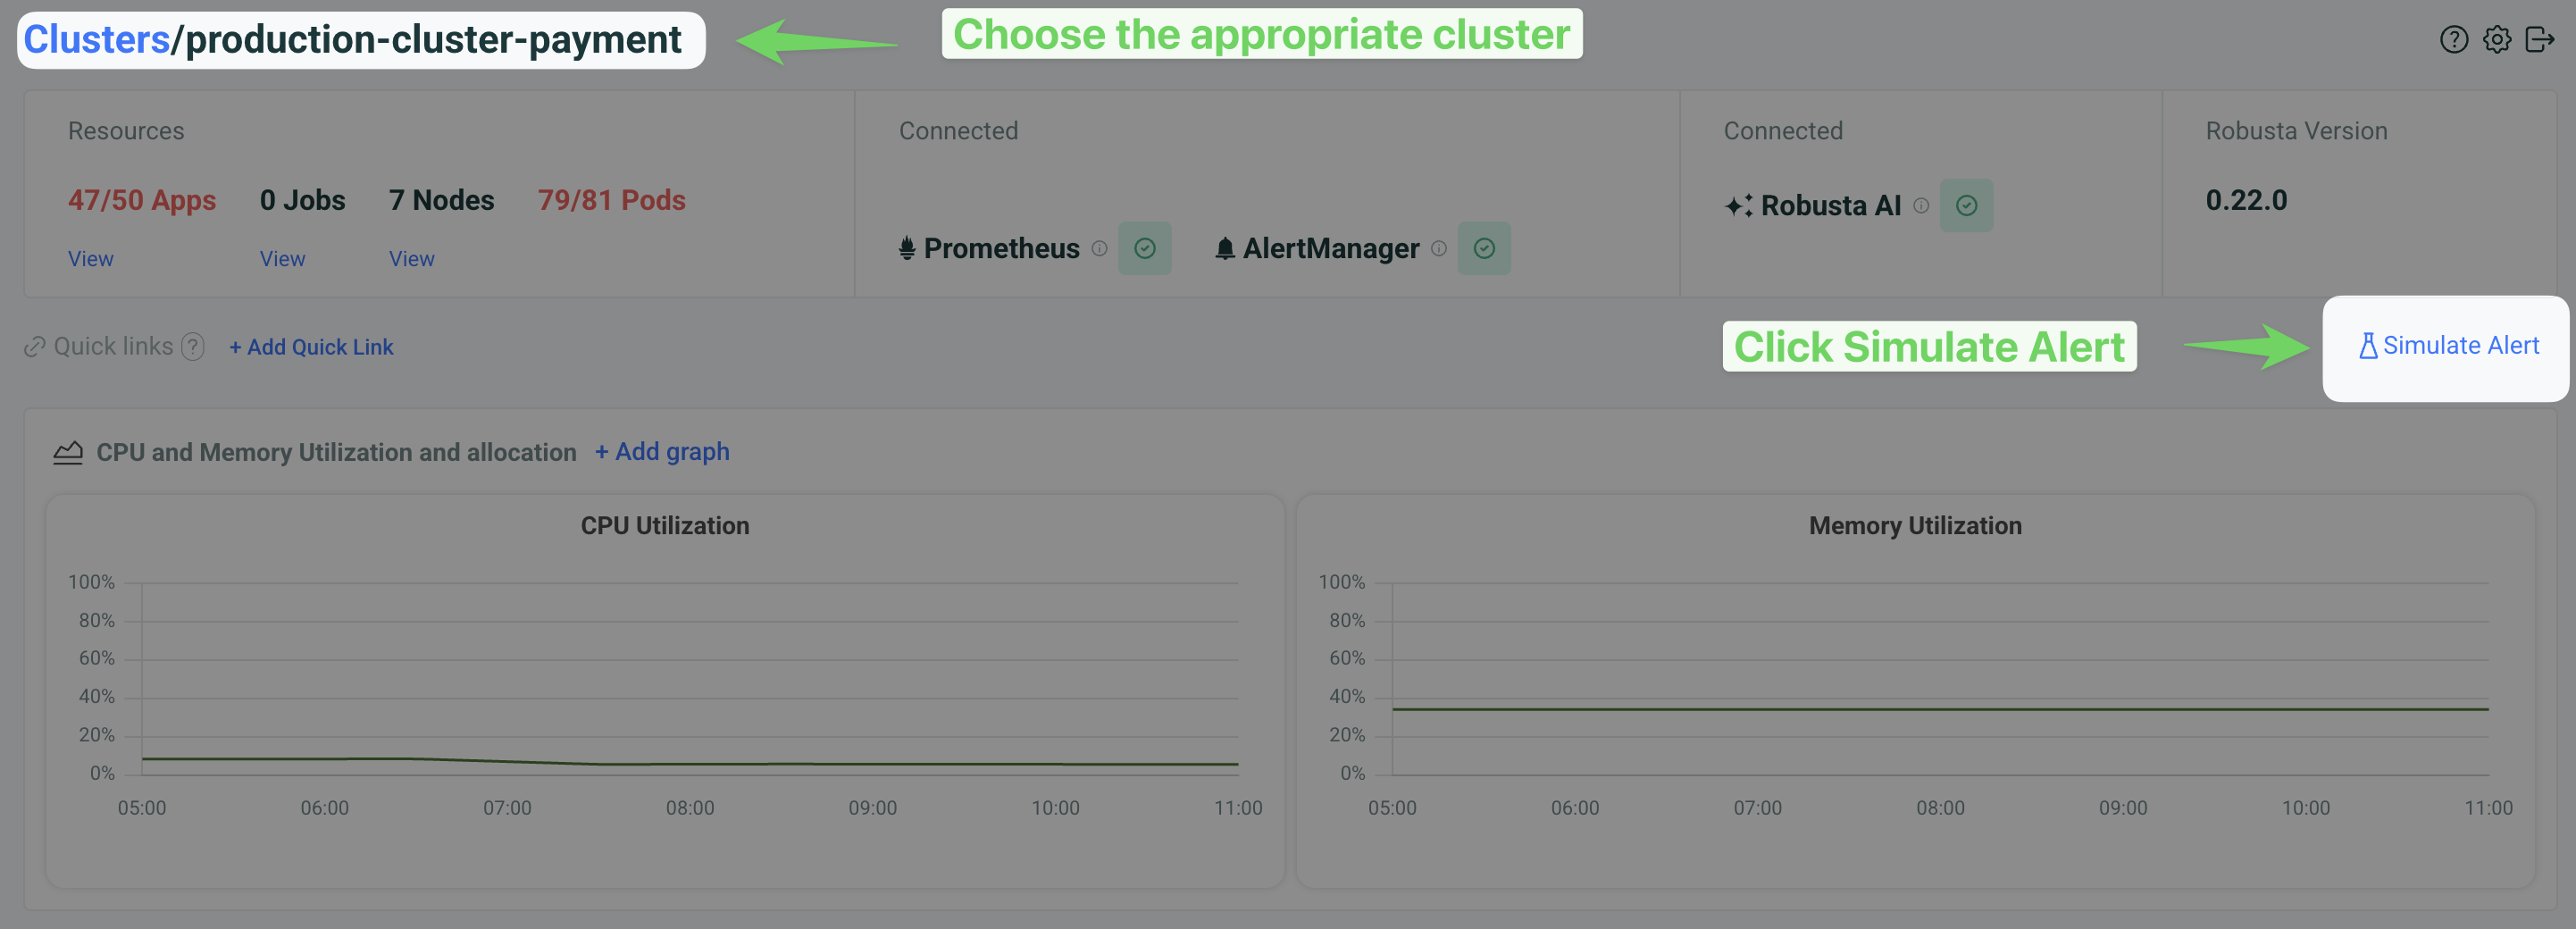
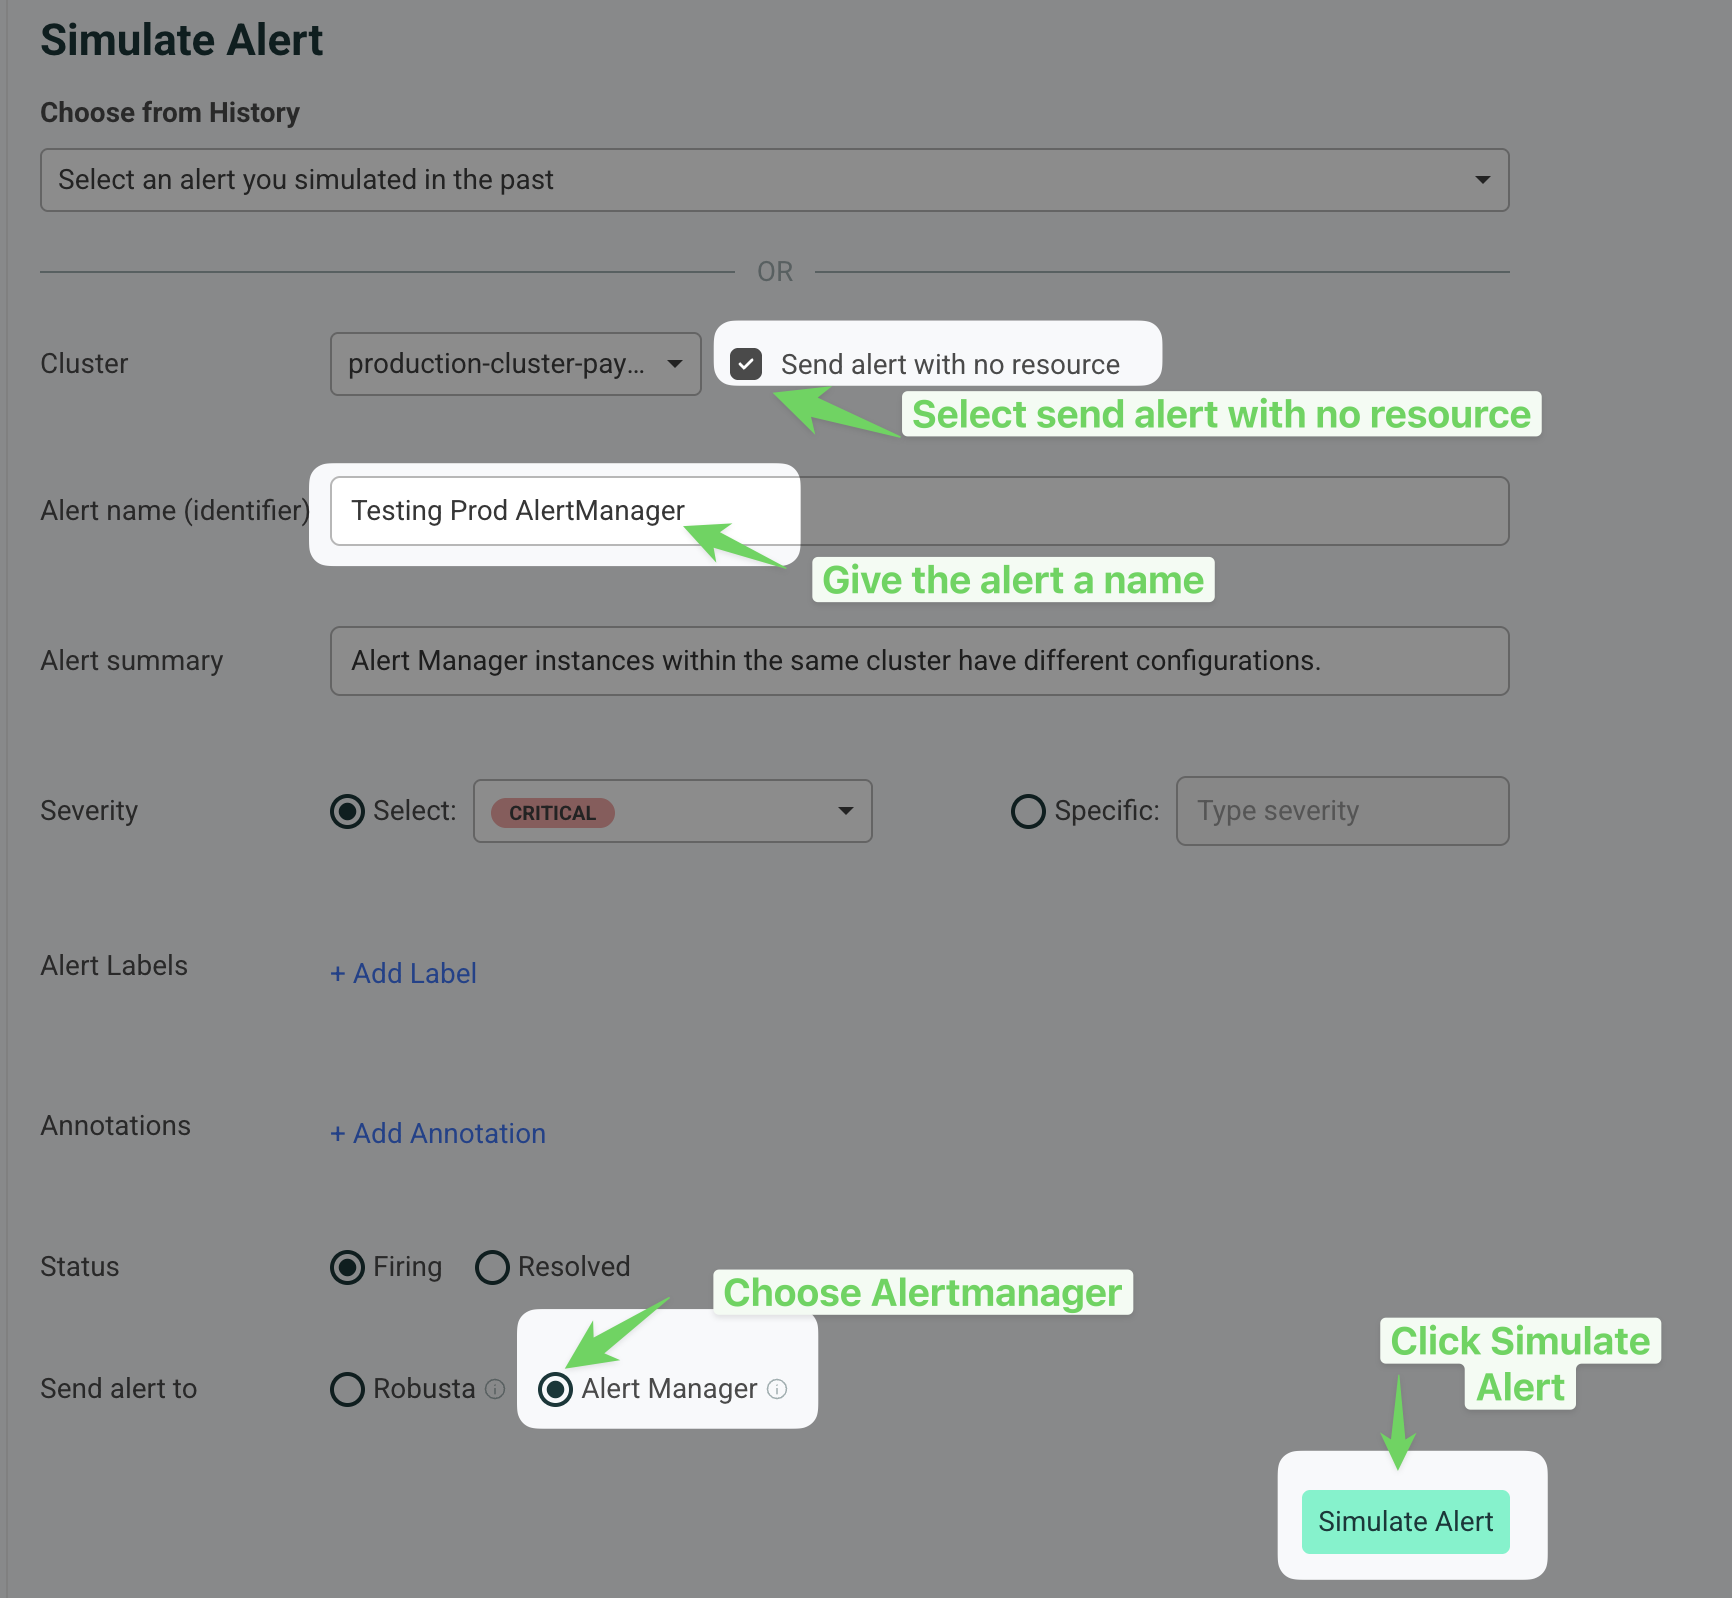
Then
Check Send alert with no resource.
Provide a name for the alert in the Alert name (identifier) field (e.g., "Testing Prod AlertManager").
Select Alert Manager under the "Send alert to" section.
Click the Simulate Alert button to send the test alert.
If everything is setup properly, this alert will reach Robusta. It will show up in the Robusta UI, Slack, and other configured sinks.
Note
It might take a few minutes for the alert to arrive due to AlertManager's group_wait and group_interval settings. More info here.
I configured AlertManager, but I'm not receiving alerts?
Try sending a demo-alert as described above. If nothing arrives, check:
AlertManager UI status page - verify that your config was picked up
kube-prometheus-operator logs (if relevant)
AlertManager logs
Reach out on Slack for assistance.
Robusta isn't mapping alerts to Kubernetes resources
Robusta enriches alerts with Kubernetes and log data using Prometheus labels for mapping. Standard label names are used by default. If your setup differs, you can customize this mapping to fit your environment.
Configure Metric Querying
To enable Robusta to pull metrics and create silences, you need to configure Prometheus and AlertManager URLs.
See Prometheus and metrics configuration for detailed instructions.
Note
Robusta will attempt to auto-detect Prometheus and AlertManager URLs in your cluster. Manual configuration is only needed if auto-detection fails.