Java jmap and stack
In this tutorial, you will use Robusta to troubleshoot a java application running on Kubernetes.
The following is currently supported:
Using jmap to troubleshoot memory leaks
Using jstack to get thread dumps
Note
GKE, AKS, and EKS are all supported. As of now, KIND and Minikube are not yet supported.
Doing it
You need a Java application to debug. To create a demo application on your cluster run:
kubectl apply -f https://raw.githubusercontent.com/robusta-dev/java_toolkit/416d62ba6a6c6cb2e5270c4cf793d340b708b9ea/java_test_pod/test_pod_config.yaml
Now run a Robusta troubleshooting action called java_process_inspector. Make sure to replace the pod's name below with the actual pod name:
robusta playbooks trigger java_process_inspector name=test-java-pod namespace=default
You should receive a message (by default in Slack) with the troubleshooting options to run on your pod.
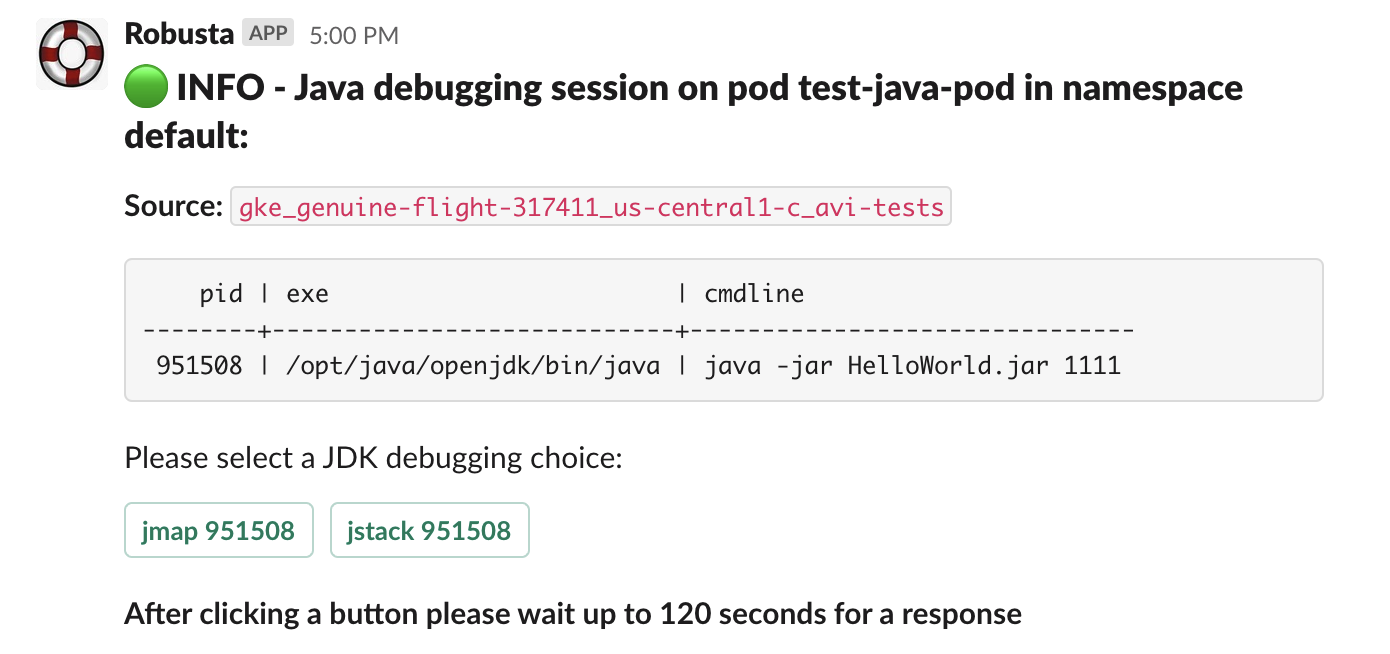
Click the buttons in Slack to run jmap or jstack. See Java Troubleshooting for more information on what each of the debugging choices do.
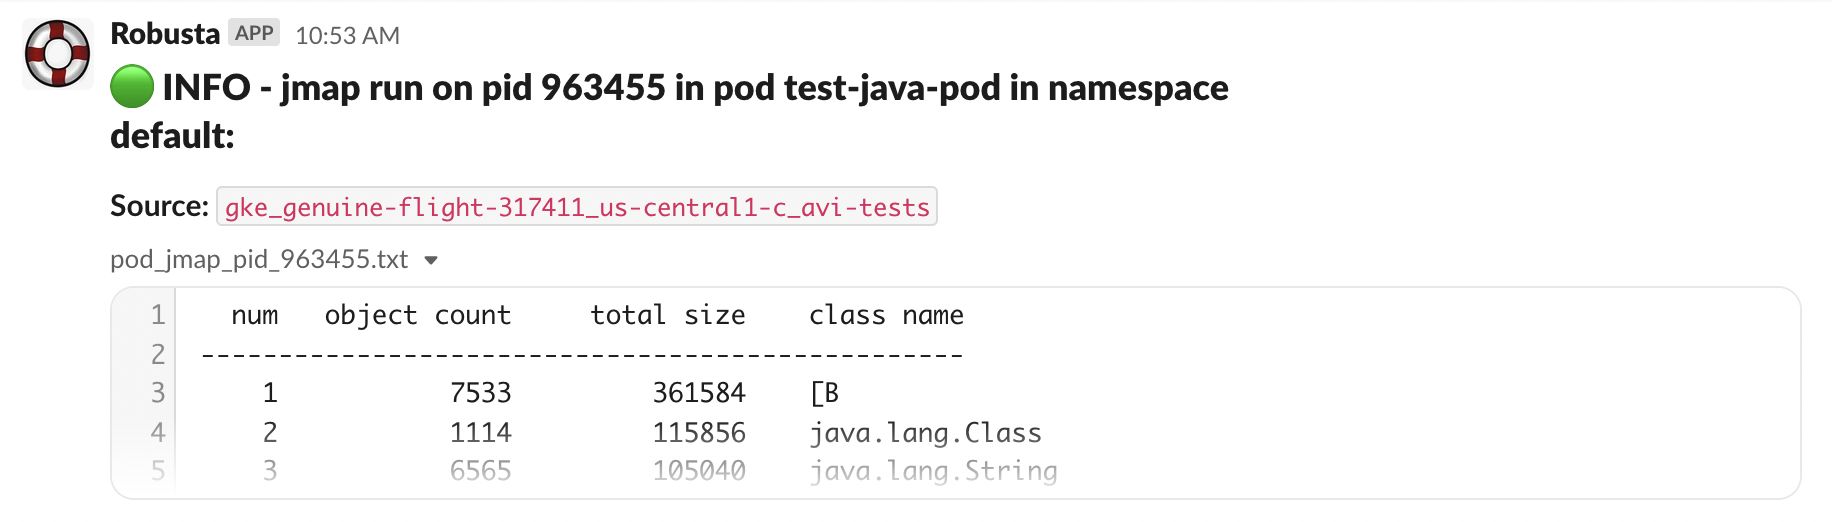
As an example, here is jmap output showing the application's memory usage:
Learn more
Java Troubleshooting