Send Alerts API
Why Send Your Alerts to Robusta?
Benefits include:
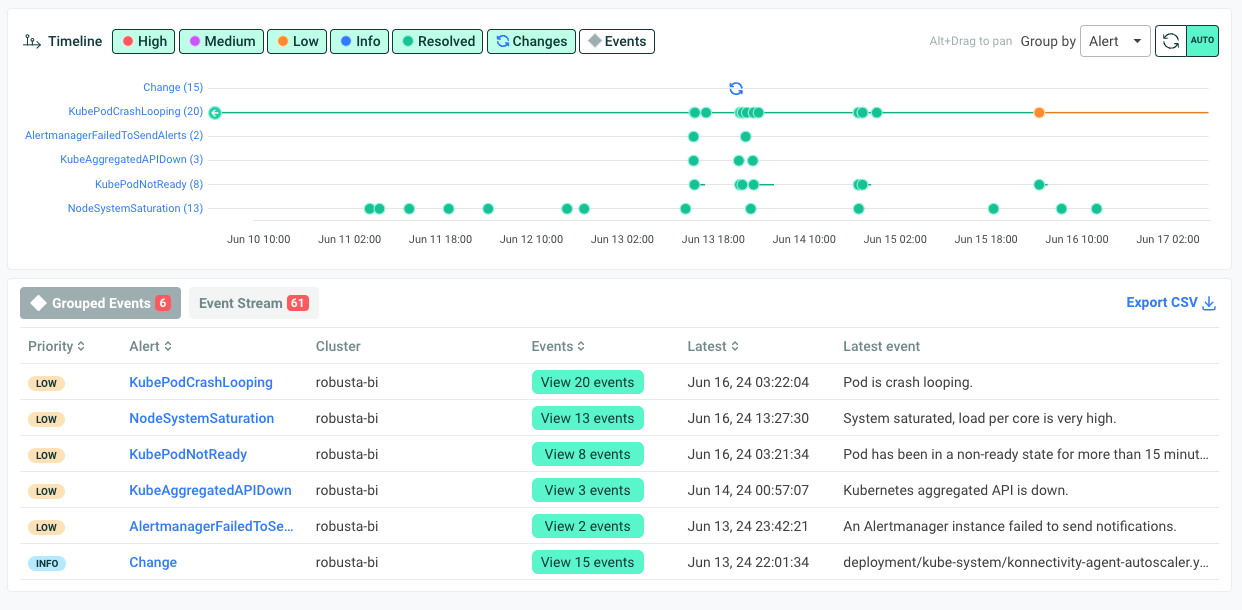
Persistent alert history on a filterable timeline
Centralized view of alerts from all your monitoring systems (multiple Prometheus instances, cloud services, custom tools)
AI investigation of alerts
Correlations between alerts and Kubernetes deploys
and more!

Integration Methods
There are two main ways to send alerts to Robusta:
Pre-built Integrations: Use our existing integrations for AlertManager, Nagios, SolarWinds, and other monitoring systems. See Send Alerts.
Programmatic API: Send alerts directly using our REST API (detailed below).
Send Alerts API
Note
This API is available with the Robusta SaaS platform and self-hosted commercial plans. It is not available in the open-source version.
Use this endpoint to send alert data to Robusta. You can send up to 1000 alerts in a single request.
POST https://api.robusta.dev/api/alerts
Request Body Schema
The request body must include the following fields:
Field |
Type |
Description |
Required |
|---|---|---|---|
|
string |
The unique account identifier. |
Yes |
|
list |
A list of alerts to be sent. |
Yes |
Alert Schema
Each alert in the alerts list must follow the specific schema, which includes the following fields:
Field |
Type |
Description |
Required |
|---|---|---|---|
|
string |
A short description of the alert. |
Yes |
|
string |
A detailed description of the alert |
Yes |
|
string |
The source of the alert. |
Yes |
|
string (one of: |
The priority level of the alert. |
Yes |
|
string |
A key to group alerts that are related. |
Yes |
|
boolean |
Indicates whether the alert represents a failure (default: |
No |
|
string (ISO 8601 timestamp) |
The timestamp when the alert started (optional). |
No |
|
string (ISO 8601 timestamp) |
The timestamp when the alert ended (optional). |
No |
|
dict |
Extra labels for the alert (optional). |
No |
|
dict |
Extra annotations for the alert (optional). |
No |
|
string |
Alert's cluster (default: |
No |
|
string |
A key identifying the service related to the alert (optional). |
No |
|
string |
The type of subject related to the alert (optional). |
No |
|
string |
The name of the subject related to the alert (optional) |
No |
|
string |
The namespace of the subject related to the alert (optional). |
No |
|
string |
The node where the subject related to the alert is located (optional). |
No |
|
string |
A unique identifier for the alert (optional). |
No |
Example Request
Here is an example of a POST request to send a list of alerts:
curl --location --request POST 'https://api.robusta.dev/api/alerts' \
--header 'Authorization: Bearer API-KEY' \
--header 'Content-Type: application/json' \
--data-raw '{
    "account_id": "ACCOUNT_ID",
    "alerts": [
        {
            "title": "Test Service Down",
            "description": "The Test Service is not responding.",
            "source": "monitoring-system",
            "priority": "high",
            "aggregation_key": "test-service-issues",
            "failure": true,
            "starts_at": "2024-10-07T10:00:00Z",
            "labels": {
                "environment": "production"
            },
            "annotations": {
                "env1": "true"
            },
            "cluster": "prod-cluster-1",
            "subject_namespace": "prod",
            "subject_node": "gke-prod-cluster-1-node-1"
        }
    ]
}'
In this request, replace the following placeholders:
ACCOUNT_ID: Your account ID, which can be found in yourgenerated_values.yamlfile.API-KEY: Your API Key for authentication. You can generate this token by navigating to Settings -> API Keys -> New API Key.
Request Headers
Header |
Description |
|---|---|
|
Bearer token for authentication (e.g., |
|
Must be set to |
Response Format
Success Response
If the request is successful, the API will return the following response:
{
    "success": true
}
Status Code: 200 OK
Error Response
If there is an error in processing the request, the API will return the following format:
{
    "msg": "Error message here",
    "error_code": 123
}
Status Code: Varies based on the error (e.g., 400 Bad Request, 500 Internal Server Error).
Troubleshooting
Not receiving alerts in Robusta UI?
Just installed? Wait 10 minutes after installation for all components to initialize
Check your specific integration: Each alert source has its own troubleshooting guide on its documentation page
Verify authentication: Ensure API keys and webhook URLs are correctly configured
Not receiving alerts?
Verify routing configuration:
Ensure Robusta is the first receiver in your AlertManager configuration, or
All previous receivers have
continue: truesetSee configuration examples in your specific alert source documentation
Check logs for errors:
Review AlertManager logs for webhook errors
Check Prometheus Operator logs (if using kube-prometheus-stack)
Look for errors in Robusta runner logs
Check pod health (embedded Prometheus stack):
Verify all Prometheus and AlertManager pods are running
Look for OOMKills and increase memory limits if needed
Alerts arriving but missing Kubernetes context?
Check Alert Label Mapping to customize how Prometheus labels map to Kubernetes resources.
Testing Your Integration
Each alert source has specific testing methods:
Standard AlertManager: Use
robusta demo-alertcommandCloud Services: Check the specific service's documentation for test procedures
Custom API: Use the curl example above with test data
Refer to your specific integration documentation for detailed testing steps.
Need More Help?
Join our Slack community for direct support