List of built-in playbooks
Warning
This page contains out-of-date information. It is currently being updated to reflect Robusta’s new configuration format.
Application Visibility and Troubleshooting
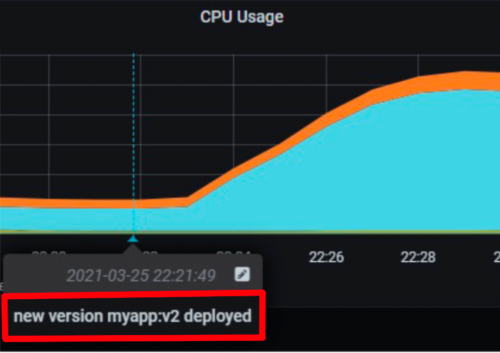
add_deployment_lines_to_grafana
Playbook Action
Add annotations to Grafana when a Kubernetes resource is updated and the image tags change.
Supports Deployments, ReplicaSets, DaemonSets, StatefulSets, Jobs, and Pods
- grafana_api_key (str)
grafana key with write permissions.
- grafana_dashboard_uid (str)
dashboard ID as it appears in the dashboard’s url
- grafana_url (str)
http(s) url of grafana or None for autodetection of an in-cluster grafana
- cluster_name (str)
writen as one of the annotation’s tags
- cluster_zone (str)
- custom_tags (str list)
custom tags to add to the annotation
on_kubernetes_any_resource_update
actions:
- add_deployment_lines_to_grafana:
    grafana_api_key: '********'
    grafana_dashboard_uid: 09ec8aa1e996d6ffcd6817bbaff4db1b
    grafana_url: http://grafana.namespace.svc
triggers:
- on_kubernetes_any_resource_update: {}
@action
def add_deployment_lines_to_grafana(
    event: KubernetesAnyChangeEvent, action_params: GrafanaAnnotationsParams
):
    """
    Add annotations to Grafana when a Kubernetes resource is updated and the image tags change.

    Supports Deployments, ReplicaSets, DaemonSets, StatefulSets, Jobs, and Pods
    """
    new_images = extract_images(event.obj)
    old_images = extract_images(event.old_obj)
    if new_images == old_images:
        return

    if len(event.obj.metadata.ownerReferences) != 0:
        return  # not handling runtime objects

    msg = ""
    if new_images.keys() != old_images.keys():
        msg = f"number or names of images changed<br /><br />new<pre>{new_images}</pre>old<pre>{old_images}</pre>"
    else:
        for name in new_images:
            if new_images[name] != old_images[name]:
                msg += f"image name:<pre>{name}</pre>new tag:<pre>{new_images[name]}</pre>old tag<pre>{old_images[name]}</pre><hr class='solid'>"

    grafana = Grafana(
        action_params.grafana_api_key.get_secret_value(), action_params.grafana_url
    )
    tags = [
        event.obj.metadata.name,
        event.obj.metadata.namespace,
        action_params.cluster_name,
    ]
    if action_params.cluster_zone:
        tags.append(action_params.cluster_zone)
    if action_params.custom_tags:
        tags.extend(action_params.custom_tags)

    grafana.add_line_to_dashboard(action_params.grafana_dashboard_uid, msg, tags=tags)
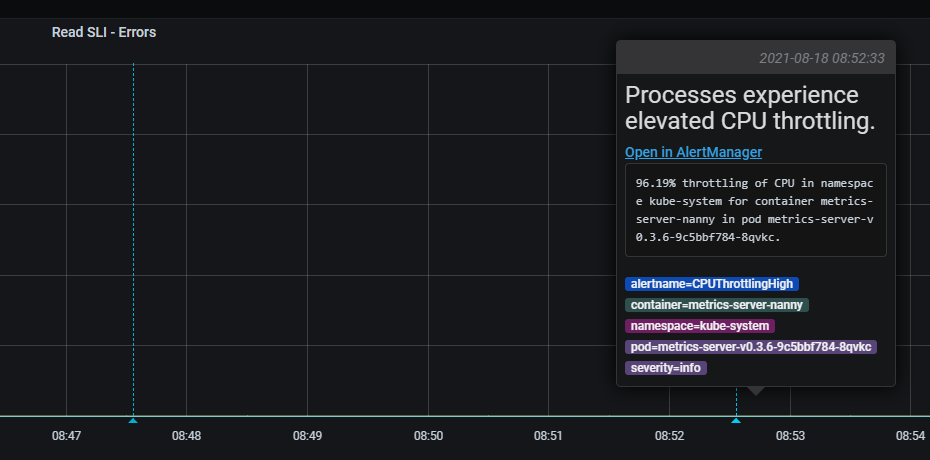
add_alert_lines_to_grafana
Playbook Action
No description
- grafana_api_key (str)
grafana key with write permissions.
- annotations (complex list)
list of alerts and which dashboard to write them to
each entry contains:
required:- alert_name (str)
- dashboard_uid (str)
- dashboard_panel (str)
when present, annotations will be added only to panels with this text text in their title.
- grafana_url (str)
http(s) url of grafana or None for autodetection of an in-cluster grafana
on_prometheus_alert
actions:
- add_alert_lines_to_grafana:
    annotations:
    - alert_name: CPUThrottlingHigh
      dashboard_uid: 09ec8aa1e996d6ffcd6817bbaff4db1b
    - alert_name: CPUThrottlingHigh
      dashboard_uid: 09ec8aa1e996d6ffcd6817bbaff4db1b
    grafana_api_key: '********'
    grafana_url: http://grafana.namespace.svc
triggers:
- on_prometheus_alert: {}
@action
def add_alert_lines_to_grafana(
    event: PrometheusKubernetesAlert, params: AlertLineParams
):
    grafana = Grafana(params.grafana_api_key.get_secret_value(), params.grafana_url)
    for annotation_config in params.annotations:
        if annotation_config.alert_name != event.alert_name:
            continue

        if event.get_description():
            description = f"<pre>{event.get_description()}</pre>"
        else:
            description = ""
        grafana.add_line_to_dashboard(
            annotation_config.dashboard_uid,
            f'<h2>{event.get_title()}</h2><a href="{event.alert.generatorURL}">Open in AlertManager</a>{description}',
            tags=[f"{k}={v}" for k, v in event.alert.labels.items()],
            panel_substring=annotation_config.dashboard_panel,
        )
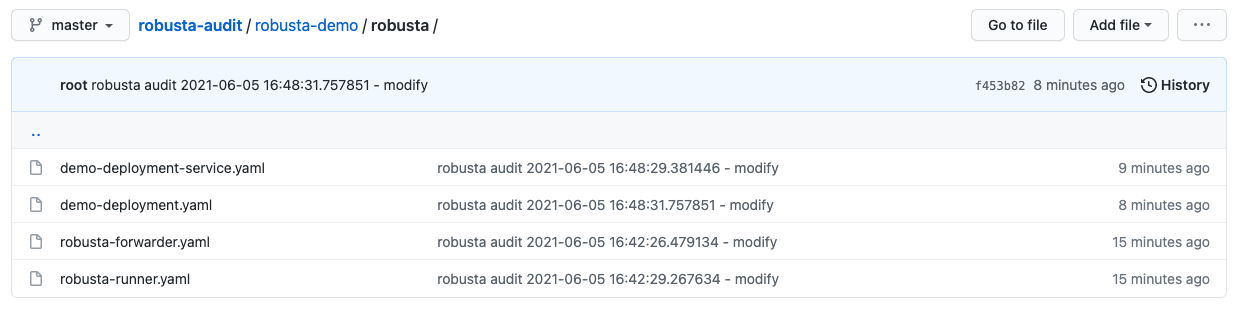
git_change_audit
Playbook
What it does: syncs Kubernetes resources from the cluster to git as yaml files (cluster/namespace/resources hierarchy)
When it runs: when a configuration spec changes in the cluster
playbooks:
  - name: "git_change_audit"
    action_params:
      cluster_name: "robusta-demo"
      git_url: "git@github.com/robusta/robusta-audit.git"
      git_key: |
        -----BEGIN OPENSSH PRIVATE KEY-----
        YOUR PRIVATE KEY DATA
        -----END OPENSSH PRIVATE KEY-----
      ignored_changes:
        - "replicas"
cluster_name Used as the root directory in the repo. should be different, for different Kubernetes clusters
ignored_changes an optional parameter, used to filter out irrelevant changes. In the example above, we filter out changes to spec.replicas, so that HPA changes won’t appear as spec changes
git_url url to a github repository
git_key github deployment key on the audit repository, with allow write access. To set this up generate a private/public key pair for GitHub.
Store the public key as the Github deployment key and the private key in the playbook configuration.
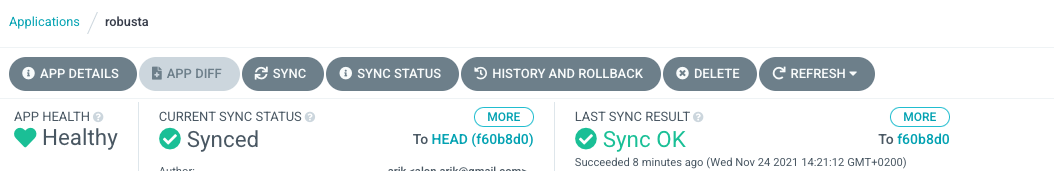
argo_app_sync
Playbook
What it does: syncs an Argo CD application
When it runs: can be triggered by any event or manually
playbooks:
  - name: "argo_app_sync"
    action_params:
      argo_url: "https://my-argo.server.com"
      argo_token: "ARGO TOKEN"
      argo_app_name: "my app name"
argo_url Argo CD server url
argo_token Argo CD authentication token
argo_app_name Argo CD application that needs syncing
Optional:
argo_verify_server_cert verify Argo CD server certificate. Defaults to True
rate_limit_seconds this playbook is rate limited. Defaults to 1800 seconds.
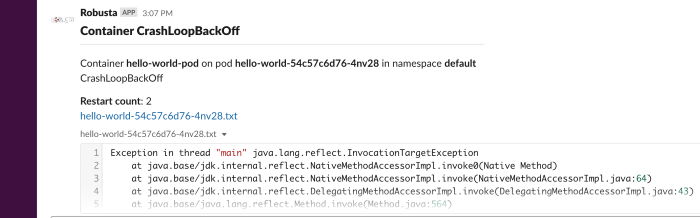
restart_loop_reporter
Playbook
What it does: send a crashing pod’s logs to slack
When it runs: when a pod crashes. (can be limited to a specific reason) .
playbooks:
  - name: "restart_loop_reporter"
    action_params:
      rate_limit: 3600
      restart_reason: "CrashLoopBackOff"
restart_reason optional parameter, defaults to any reason
rate_limit optional parameter, measured in seconds, defaults to 3600
python_profiler
Playbook
What it does: Run a CPU profiler on any Python pod
When it runs: When you trigger it manually.
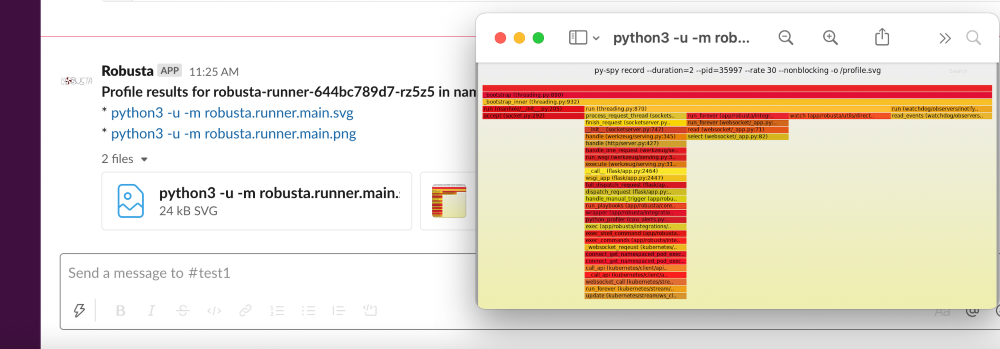
playbooks:
  - name: "python_profiler"
robusta playbooks trigger python_profiler pod_name=your-pod namespace=you-ns process_name=your-process seconds=5
pod_ps
Playbook
What it does: Gets a list of processes inside any pod prints the result in the terminal.
When it runs: Manually triggered.
More documentation coming soon
Stress Testing and Chaos Engineering
generate_high_cpu
Playbook
What it does: Causes high CPU usage in the cluster.
When it runs: Manually triggered.
More documentation coming soon
http_stress_test
Playbook
What it does: Creates many http requests for a given url
When it runs: When you trigger it manually
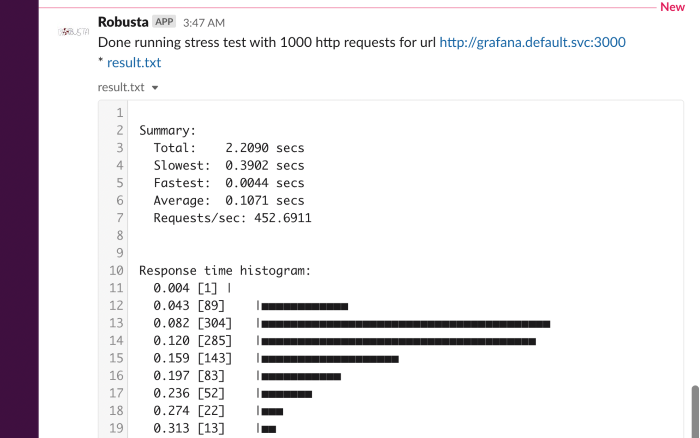
playbooks:
  - name: "http_stress_test"
robusta playbooks trigger http_stress_test url=http://grafana.default.svc:3000 n=1000
Kubernetes Monitoring
incluster_ping
Playbook
What it does: pings a hostname from within the cluster
When it runs: when you trigger it manually with a command like:
playbooks:
  - name: "incluster_ping"
robusta playbooks trigger incluster_ping hostname=grafana.default.svc
resource_babysitter
Playbook
What it does: send notifications to Slack describing changes to deployments
When it runs: when deployments are created, modified, and deleted.
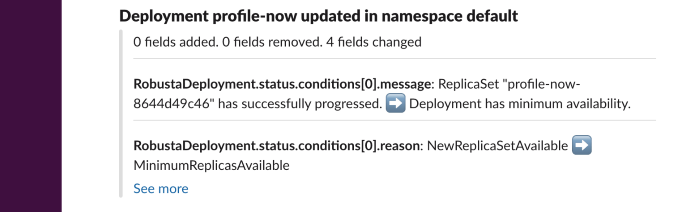
playbooks:
  - name: "deployment_babysitter"
    action_params:
      fields_to_monitor: ["spec.replicas"]
deployment_status_report
Playbook
What it does: sends screenshots of grafana panels
When it runs: After a deployment is updated, on configured time intervals
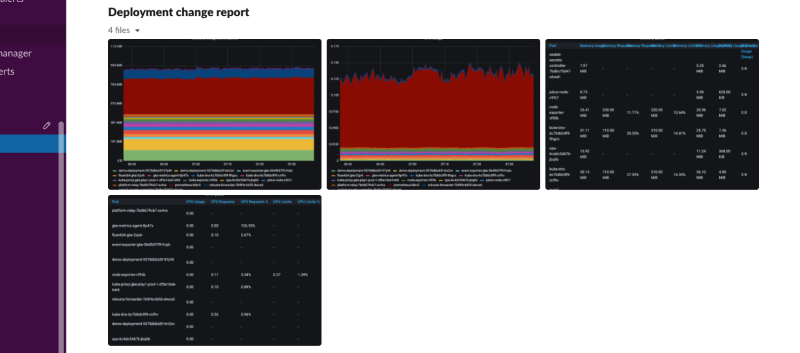
playbooks:
  - name: "deployment_status_report"
    trigger_params:
      name_prefix: "MY_MONITORED_DEPLOYMENT"
    action_params:
      report_name: "MY REPORT NAME"
      on_image_change_only: true
      delays:
      - 60       # 60 seconds after a deployment change
      - 600      # 10 minutes after the previous run, i.e. 11 minutes after the deployment change
      - 1200     # 31 minutes after the deployment change
      reports_panel_urls:
      - "http://MY_GRAFANA/d-solo/200ac8fdbfbb74b39aff88118e4d1c2c/kubernetes-compute-resources-node-pods?orgId=1&from=now-1h&to=now&panelId=3"
      - "http://MY_GRAFANA/d-solo/SOME_OTHER_DASHBOARD/.../?orgId=1&from=now-1h&to=now&panelId=3"
      - "http://MY_GRAFANA/d-solo/SOME_OTHER_DASHBOARD/.../?orgId=1&from=now-1h&to=now&panelId=3"
reports_panel_urls it’s highly recommended to put relative time arguments, rather then absolute. i.e. from=now-1h&to=now
on_image_change_only default is true, can be omitted.
Configuring no name_prefix or on_image_change_only: false, may result in too noisy channel
Kubernetes Optimization
config_ab_testing
Playbook
What it does: Apply YAML configurations to Kubernetes resources for limited periods of time. Adds adds grafana annotations showing when each configuration was applied.
When it runs: every predefined period, defined in the playbook configuration
Example use cases:
Troubleshooting - Finding the first version a production bug appeared by iterating over image tags
Cost/performance optimization - Comparing the cost or performance of different deployment configurations
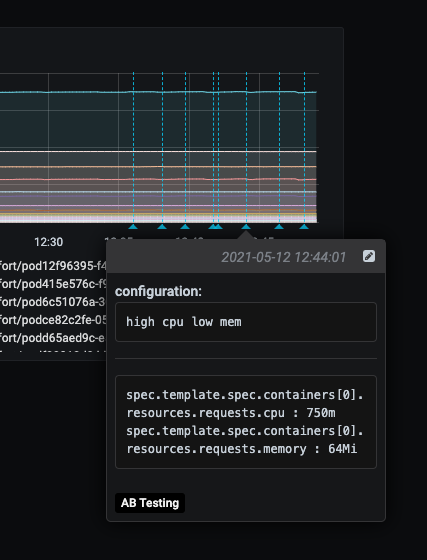
playbooks:
  - name: "config_ab_testing"
    trigger_params:
      seconds_delay: 1200 # 20 min
    action_params:
      grafana_dashboard_uid: "uid_from_url"
      grafana_api_key: "grafana_api_key_with_editor_role"
      grafana_url: "https://mygrafana.mycompany.com"
      kind: "deployment"
      name: "demo-deployment"
      namespace: "robusta"
      configuration_sets:
      - config_set_name: "low cpu high mem"
        config_items:
          "spec.template.spec.containers[0].resources.requests.cpu": 250m
          "spec.template.spec.containers[0].resources.requests.memory": 128Mi
      - config_set_name: "high cpu low mem"
        config_items:
          "spec.template.spec.containers[0].resources.requests.cpu": 750m
          "spec.template.spec.containers[0].resources.requests.memory": 64Mi
Only changing attributes that already exists in the active configuration is supported. For example, you can change resources.requests.cpu, if that attribute already exists in the deployment.
disk_benchmark
Playbook
What it does: Automatically create a persistent volume and run a disk performance benchmark with it.
When it runs: When manually triggered
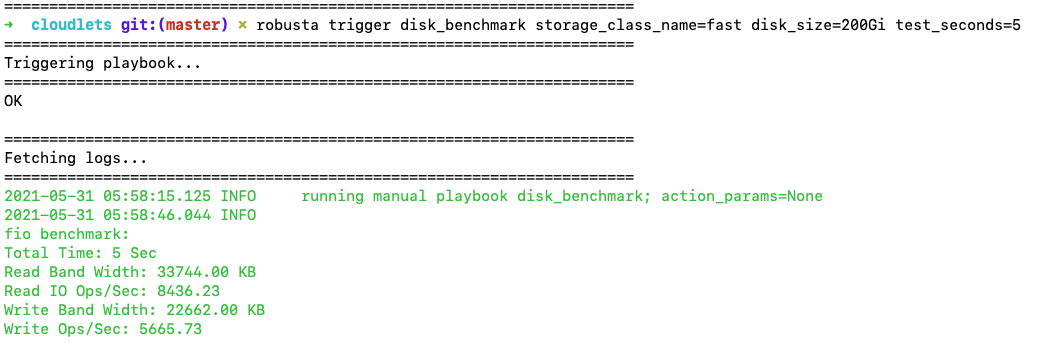
playbooks:
  - name: "disk_benchmark"
robusta playbooks trigger disk_benchmark storage_class_name=fast disk_size=200Gi test_seconds=60
When the benchmark is done, all the resources used for it will be deleted.
storage_class_name should be one of the StorageClasses available on your cluster
Kubernetes Error Handling
HPA max replicas
Playbook
What it does: Send a slack notification and allow increasing the HPA max replicas limit
When it runs: When an HPA object reaches the max replicas limit
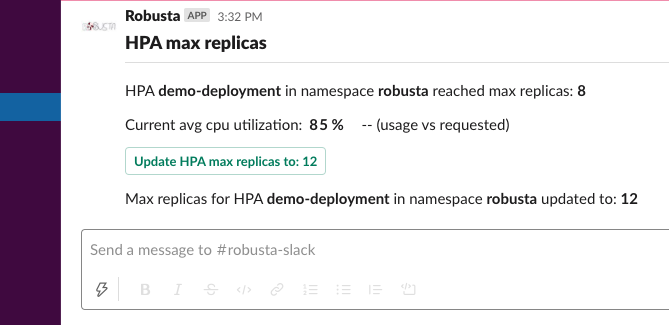
playbooks
- name: "alert_on_hpa_reached_limit"
  action_params:
    increase_pct: 20   # Increase factor (%)
Alert Enrichment
This is a special playbook that has out-of-the box knowledge about specific Prometheus alerts. See Prometheus Alert Enrichment for details.