Manual Triggers
Robusta automates tasks in Kubernetes clusters with a library of re-usable actions.
These actions can be triggered automatically (when supported triggers occur) or on-demand (manually triggered) by running a CLI command. Most actions support both types of triggers.
We'll focus below on actions which are most useful when triggered manually.
Example Manual Triggers
Here are some high-level tasks included in Robusta's library of actions:
Stress-test a pod over HTTP
Show recent OOM kills
All these tasks can be done without Robusta, but they're annoying to do. We automated them for you.
How to use manual triggers
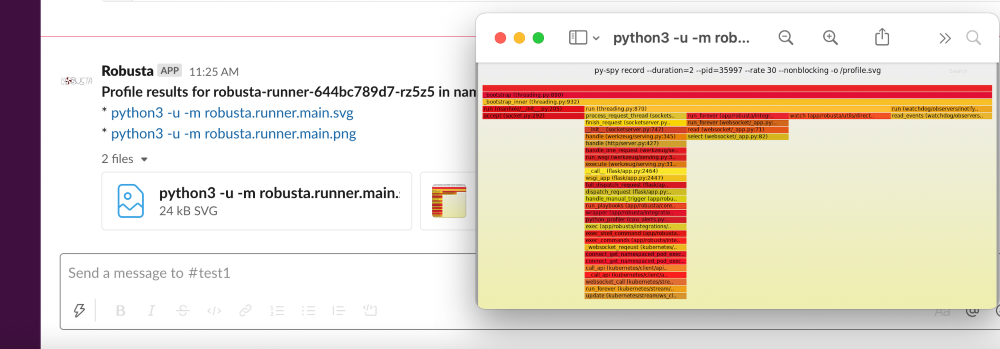
Let's manually run the python_profiler playbook:
robusta playbooks trigger python_profiler name=robusta-runner-8f4558f9b-pcbj9 namespace=default seconds=5
The result will be sent to the sink. Here is an example result in Slack:
How manual triggers work
Like every Robusta action, manual playbooks are just re-usable Python functions.
The above python_profiler is a built-in Robusta action. It takes a Pod as input and can be run automatically:
customPlaybooks:
- triggers:
    - on_prometheus_alert:
        alert_name:  "HighCPU"
  actions:
    - python_profiler:
        seconds: 5
Or it can be run manually like we did here.
Full reference
Most playbooks can be triggered manually as follows:
robusta playbooks trigger <action_name> name=<name> namespace=<namespace> kind=<kind> <key>=<value>
The parameters above are:
- name
The name of a Kubernetes resource
- namespace
The resource's namespace
- kind
pod,deployment, or any other resource the action supports. This can be left out for playbooks that support one input type.- <key>=<value>
Any additional parameters the action needs