Prometheus Alert Enrichment
Warning
This page contains out-of-date information. It is currently being updated to reflect Robusta’s new configuration format.
Introduction
Robusta has special features for handling Prometheus alerts in Kubernetes clusters including:
Enrichers: playbooks that enrich alerts with extra information based on the alert type
Silencers: playbooks that silence noisy alerts using more advanced methods than Prometheus/AlertManager’s builtin silencing feature
When trying out these features, you can leave your existing alerting Slack channel in place and add a new channel for Robusta’s improved Prometheus alerts. This will let you compare Robusta’s alerting with Prometheus’ builtin alerting.
These features are still in beta and therefore have been implemented differently than regular playbooks. To enable this mode
of operation, you configure a root alerts_integration playbook in values.yaml and then add special enrichment
and silencer playbooks underneath that playbook. In the future, this functionality will likely be merged into regular playbooks.
Configure Robusta
Configure Prometheus AlertManager
Before you can enrich prometheus alerts, you must forward Prometheus alerts to Robusta by adding a webhook receiver to AlertsManager.
See Setting up the webhook for details.
Lets look at the simplest possible configuration in values.yaml which instructs Robusta to forward Prometheus alerts to Slack without any enrichment:
playbooks:
- name: "alerts_integration"
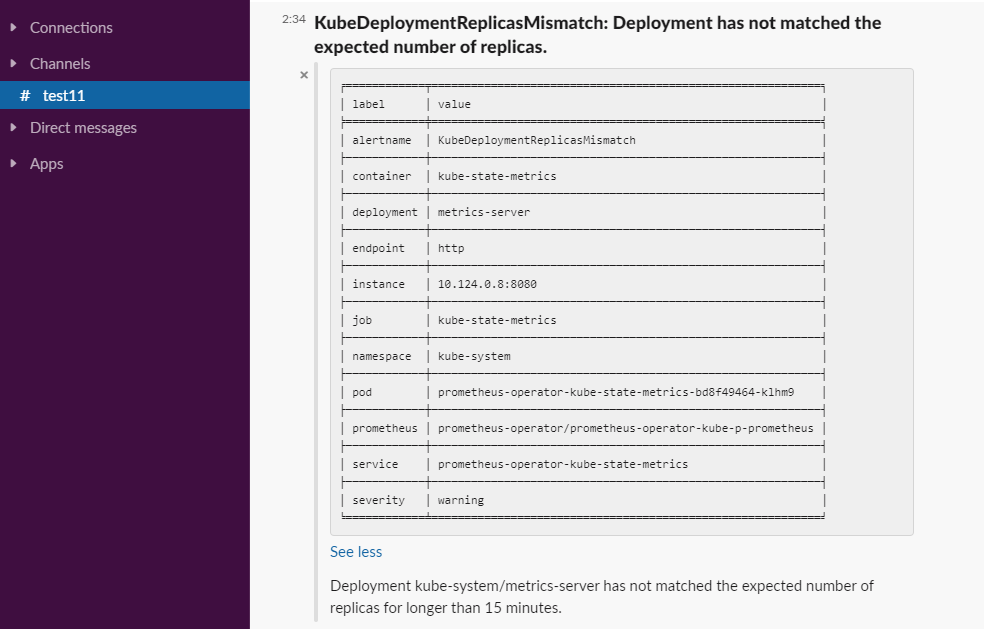
The above configuration isn’t very useful because we haven’t enriched any alerts yet. However, Robusta still sends default information for every alert as you can see below.
Adding an Enricher
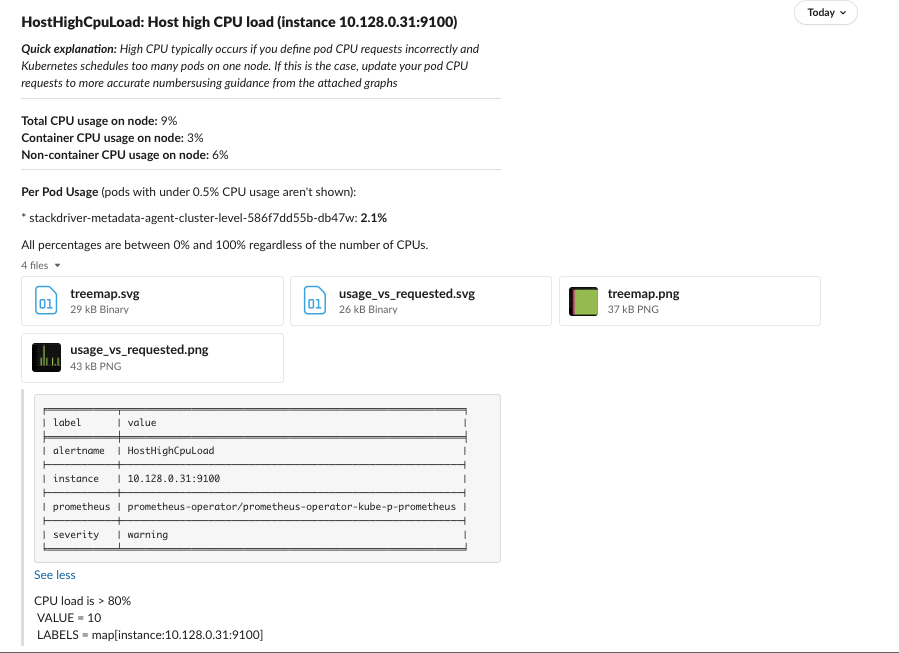
Now lets add an enricher to values.yaml which enriches the HostHighCPULoad alert:
playbooks:
- name: "alerts_integration"
  action_params:
    alerts_config:
    - alert_name: "HostHighCpuLoad"
      enrichers:
      - name: "NodeCPUAnalysis"
      - name: "AlertDefaults"
When using the above yaml, all prometheus alerts are forwarded to Slack unmodified except for the HostHighCPULoad
alert which is enriched as you can see below.
Note that adding an enricher to a specific alert always replaces the default enricher which is called AlertDefaults.
Therefore, in the above example, we explicitly added back the AlertDefaults enricher to use both the default alert message and the enrichment.


Make sure to check out the full list of enrichers to see what you can add.
Setting the default enricher
You can change the default enricher(s) for all alerts using the default_enrichers parameter.
playbooks:
- name: "alerts_integration"
  action_params:
    default_enrichers:
      - name: "AlertDefaults"
Adding a Silencer
Lets silence KubePodCrashLooping alerts in the first ten minutes after a node (re)starts:
playbooks:
- name: "alerts_integration"
  action_params:
    alerts_config:
    - alert_name: "KubePodCrashLooping"
      silencers:
      - name: "NodeRestartSilencer"
        params:
          post_restart_silence: 600 # seconds
Full example
Here are all the above features working together:
playbooks:
- name: "alerts_integration"
  action_params:
    default_enrichers:
      - name: "AlertDefaults"
    alerts_config:
    - alert_name: "HostHighCpuLoad"
      enrichers:
      - name: "NodeCPUAnalysis"
    - alert_name: "KubeDeploymentReplicasMismatch"
      enrichers:
      - name: "SomeCustomEnricher"
      - name: "AlertDefaults" # adding alert defaults as well
    - alert_name: "KubePodCrashLooping"
      silencers:
      - name: "NodeRestartSilencer"
        params:
          post_restart_silence: 600 # seconds
Available Enrichers
AlertDefaults
Send the alert message and labels to Slack
NodeCPUAnalysis
Provide analysis of node cpu usage.
Note
This enricher use prometheus. The prometheus url can be overriden in the global_config section.
For example - prometheus_url: "http://prometheus-k8s.monitoring.svc.cluster.local:9090"
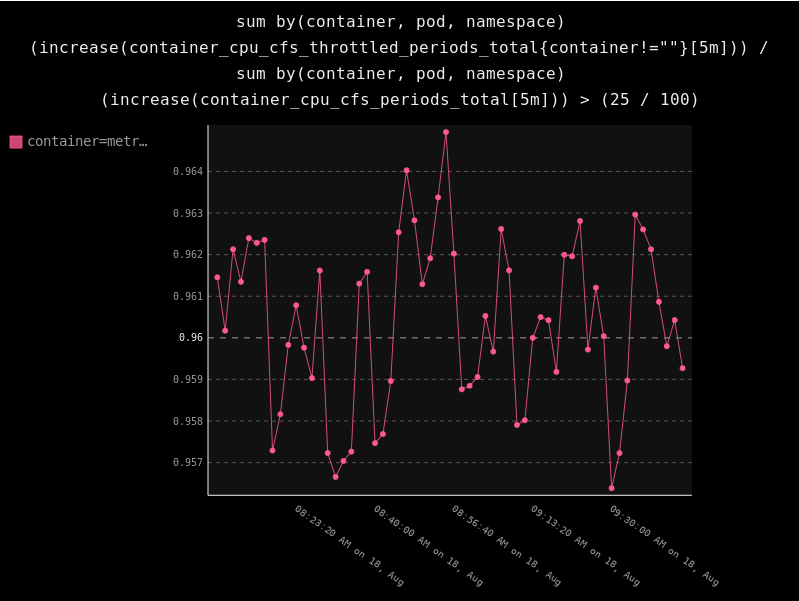
GraphEnricher
Display a graph of the Prometheus query which triggered the alert.
See note above regarding the prometheus_url parameter.
Example
TemplateEnricher
Add a paragraph to the alert’s description containing templated markdown. You can inject any of the alert’s Prometheus labels into the markdown.
A variable like $foo will be replaced by the value of the Prometheus label foo. If a label isn’t present then the text “<missing>” will be used instead.
Common variables to use are $alertname, $deployment, $namespace, and $node
The template can include all markdown directives supported by Slack. Note that Slack markdown links use a different format than GitHub.
Example
playbooks:
(...)
   - alert_name: "ContainerVolumeUsage"
     enrichers:
     - name: "TemplateEnricher"
       params:
         template: "The alertname is $alertname and the pod is $pod"
LogsEnricher
Fetch logs related to the alert and attach them to the alert as a file.
The pod to fetch logs for is determined by the alert’s pod label from Prometheus.
By default, if the alert has no label named pod then this enricher will silently do nothing. To show an explicit error, set the warn_on_missing_label parameter to true
OOMKillerEnricher
Shows which pods were recently OOM Killed on a node
StackOverflowEnricher
Add a button in Slack to search for the alert name on StackOverflow
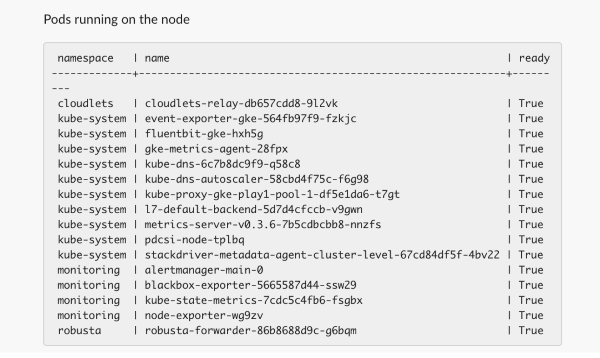
NodeRunningPodsEnricher
Add a list of the pods running on the node, with the pod Ready status
Example
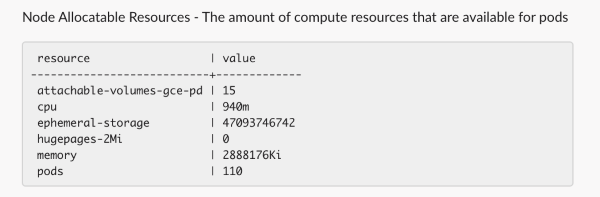
NodeAllocatableResourcesEnricher
Add the allocatable resources available on the node
Example
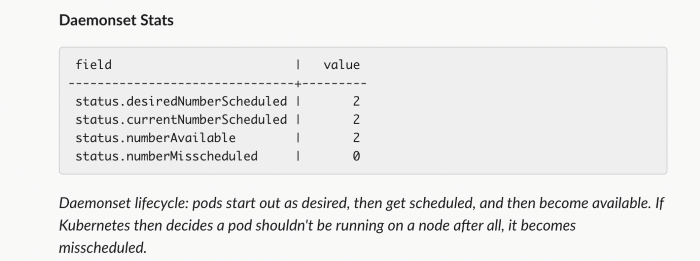
DaemonsetEnricher
For daemonset related alerts, adds details about the daemonset status
Example
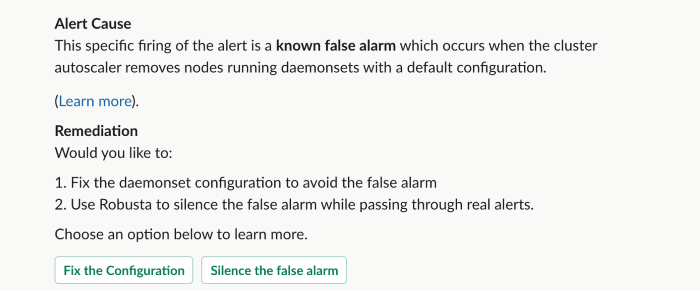
DaemonsetMisscheduledAnalysis
Analyze the known Prometheus alert KubernetesDaemonsetMisscheduled and provide actionable advice on how to fix it.
This enricher only displays output when it can verify that the alert is a false positive.
Example
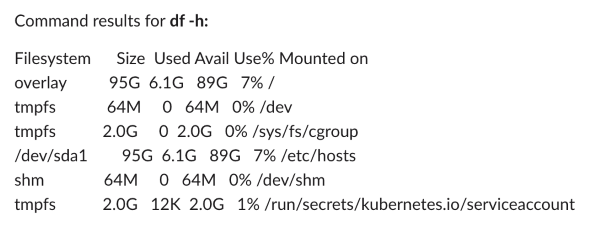
PodBashEnricher
Runs the specified bash command, on the pod associated with the alert. The bash command must already be installed in the target pod.
Example
playbooks:
(...)
   - alert_name: "ContainerVolumeUsage"
     enrichers:
     - name: "PodBashEnricher"
       params:
         bash_command: "df -h"
NodeBashEnricher
Runs the specified bash command, on the node associated with the alert
Example
playbooks:
(...)
   - alert_name: "HostOutOfDiskSpace"
     enrichers:
     - name: "NodeBashEnricher"
       params:
         bash_command: "df -h"
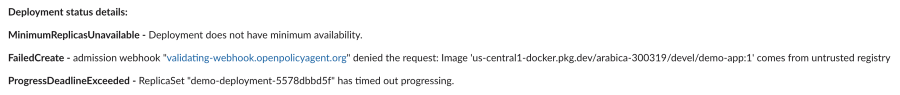
DeploymentStatusEnricher
Adds deployment condition statuses
Example
playbooks:
(...)
   - alert_name: "KubernetesDeploymentReplicasMismatch"
     enrichers:
     - name: "DeploymentStatusEnricher"
Available Silencers
NodeRestartSilencer
After a node is restarted, silence alerts for pods running on it.
Parameters
post_restart_silence: length of the silencing period in seconds; defaults to 300
DaemonsetMisscheduledSmartSilencer
Silence the Prometheus alert KubernetesDaemonsetMisscheduled under conditions matching a known false alarm