Python Troubleshooting
Robusta includes built-in actions to troubleshoot, profile, and debug Python applications on Kubernetes.
These actions can be triggered automatically on Prometheus alerts, or manually using the robusta cli.
Python debugger
Playbook Action: python_debugger
Attach a python debugger to a running pod. No need to modify the application's code or restart it.
- Steps:
Manually trigger this action using the Robusta CLI and the pod's name:
robusta playbooks trigger python_debugger name=podname namespace=defaultFollow the instructions you receive and run kubectl port-forward
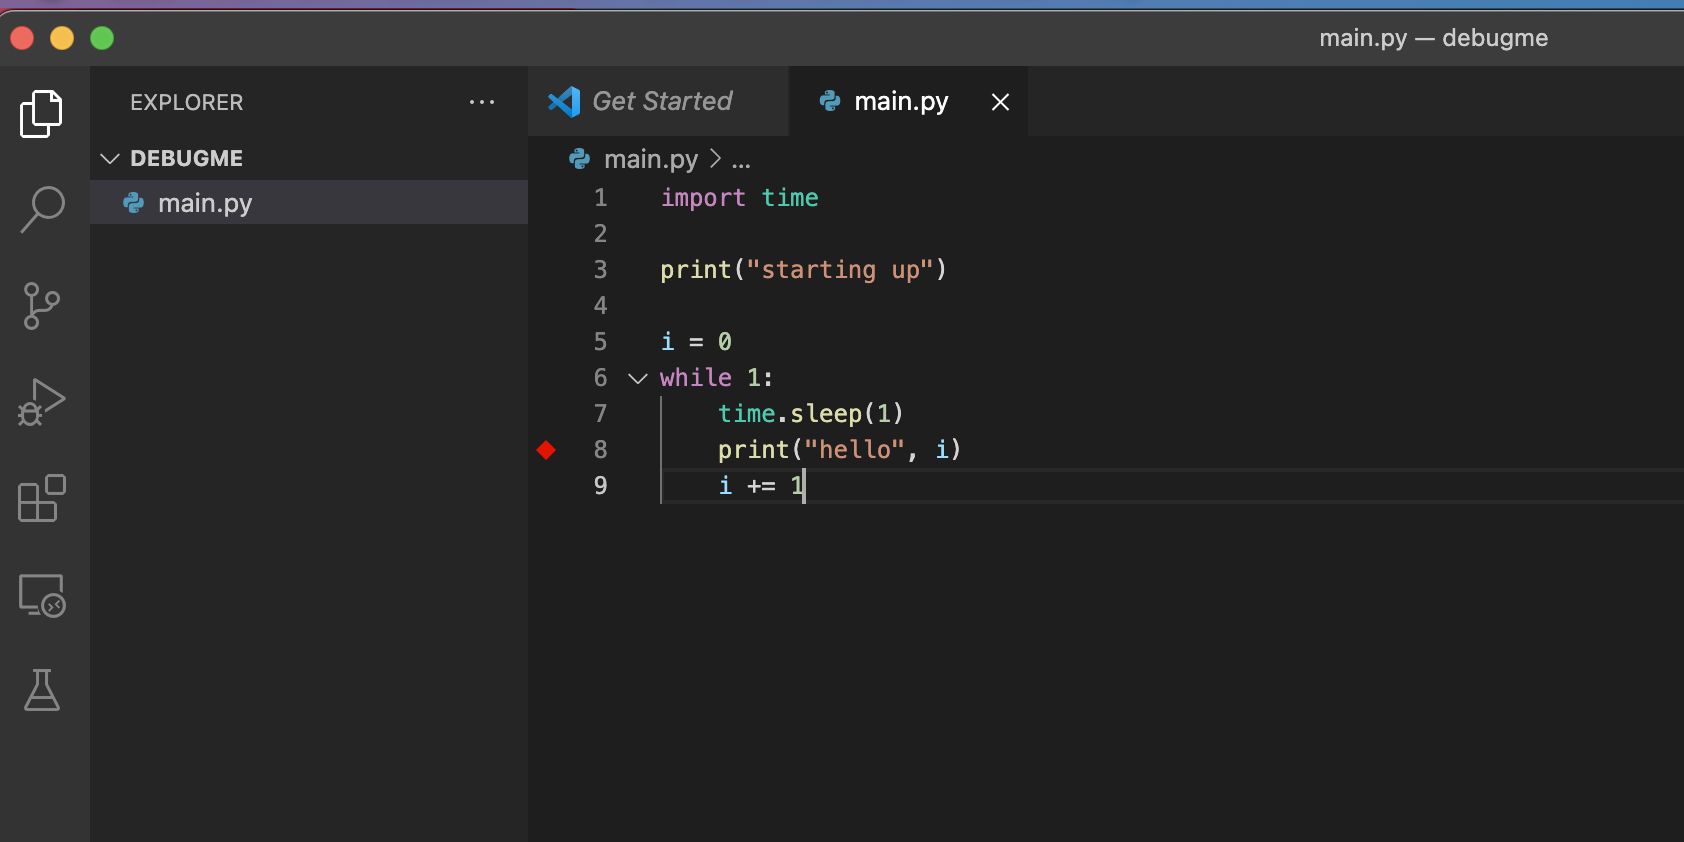
In Visual Studio Code do a Remote Attach as per the instructions
Now you can use break points and log points in VSCode.
This action has been deprecated. To enable it add the following to your generated_values.yaml
Add this to your Robusta configuration (Helm values.yaml):
customPlaybooks:
- actions:
  - python_debugger: {}
  triggers:
  - on_pod_all_changes: {}
The above is an example. Try customizing the trigger and parameters.
- custom_annotations (str dict)
custom annotations to be used for the running pod/job
- process_substring (str)
process name (or substring).
- pid (int)
pid
- interactive (bool) = True
if more than one process matches, interactively ask which process to choose.
- port (int) = 5678
debugging port.
This action can be manually triggered using the Robusta CLI:
robusta playbooks trigger python_debugger name=POD_NAME namespace=POD_NAMESPACE
Python profiler
Playbook Action: python_profiler
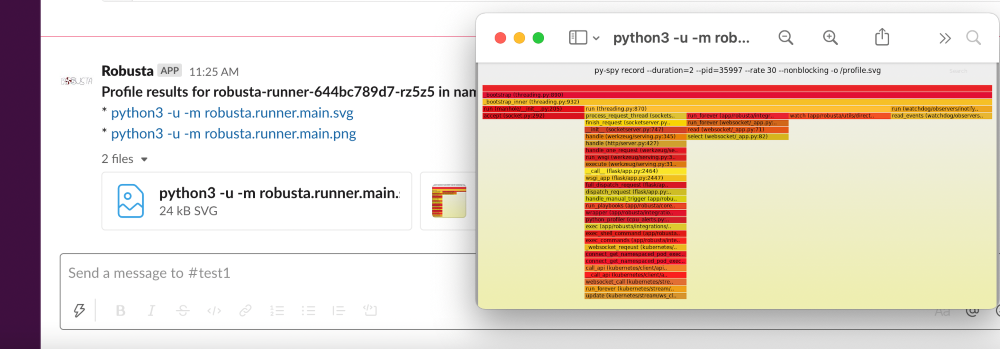
Attach a python profiler to a running pod, and run a profiling session for the specified duration.
No need to change the profiled application code, or to restart it.
This is powered by PySpy
This action has been deprecated. To enable it add the following to your generated_values.yaml
Manually trigger with:
robusta playbooks trigger python_profiler name=podname namespace=default process_name=your-process seconds=5
Add this to your Robusta configuration (Helm values.yaml):
customPlaybooks:
- actions:
  - python_profiler: {}
  triggers:
  - on_pod_all_changes: {}
The above is an example. Try customizing the trigger and parameters.
- custom_annotations (str dict)
custom annotations to be used for the running pod/job
- seconds (int) = 2
Profiling duration.
- process_name (str)
Profiled process name prefix.
- include_idle (bool)
Include idle threads
This action can be manually triggered using the Robusta CLI:
robusta playbooks trigger python_profiler name=POD_NAME namespace=POD_NAMESPACE
Python memory
Playbook Action: python_memory
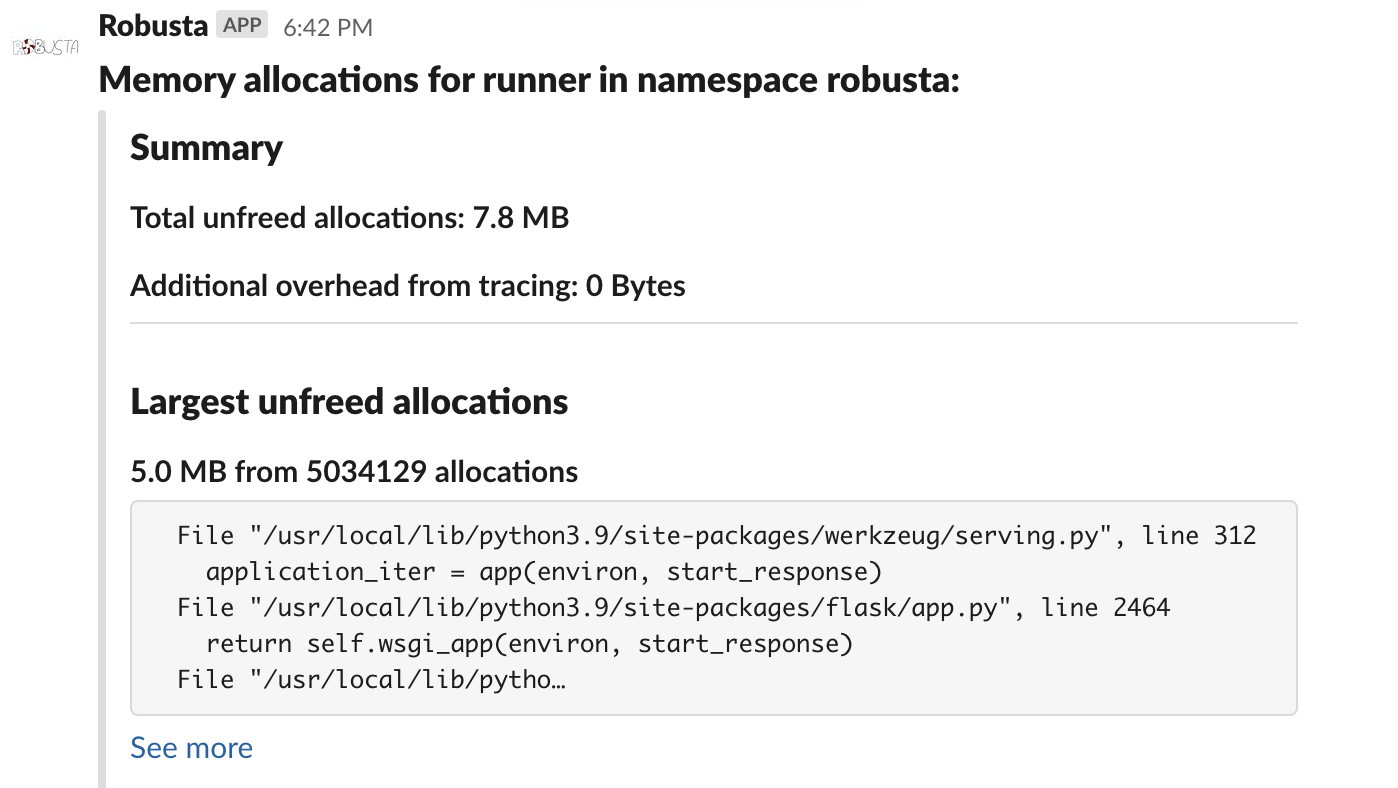
Monitor a Python process for X seconds and show memory that was allocated and not freed.
Use this to track memory leaks in your Python application on Kubernetes.
This action has been deprecated. To enable it add the following to your generated_values.yaml
Manually trigger with:
robusta playbooks trigger python_memory name=podname namespace=default
Add this to your Robusta configuration (Helm values.yaml):
customPlaybooks:
- actions:
  - python_memory: {}
  triggers:
  - on_pod_all_changes: {}
The above is an example. Try customizing the trigger and parameters.
- custom_annotations (str dict)
custom annotations to be used for the running pod/job
- process_substring (str)
process name (or substring).
- pid (int)
pid
- interactive (bool) = True
if more than one process matches, interactively ask which process to choose.
- seconds (int) = 60
Memory allocations analysis duration.
This action can be manually triggered using the Robusta CLI:
robusta playbooks trigger python_memory name=POD_NAME namespace=POD_NAMESPACE