Grafana AlertManager
Grafana can send alerts to the Robusta timeline for visualization and AI investigation.
This guide only covers sending alerts from Grafana Alerting to the Robusta timeline. If you'd like Robusta to also query metrics from Grafana, refer to general metrics-integration docs for Prometheus.
Send Alerts to Robusta's Timeline
This integration lets you send Grafana alerts to Robusta's Timeline. To configure it:
Get your Robusta
account_idfrom yourgenerated_values.yamlfile. It appears under theglobalConfigsection.Create an
api key
In the Robusta UI, navigate to the settings page, and select the API Keys tab.
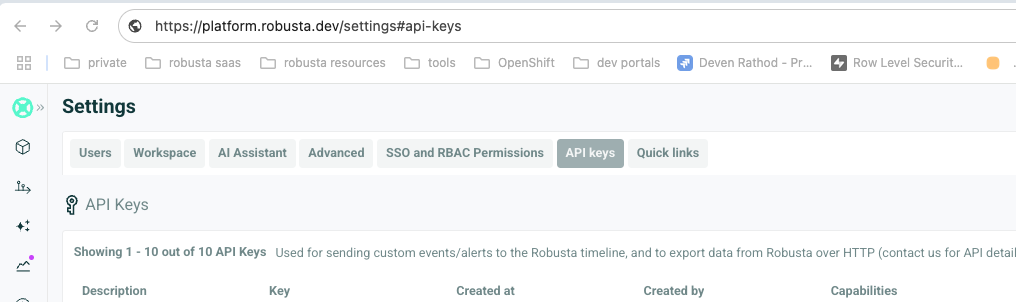
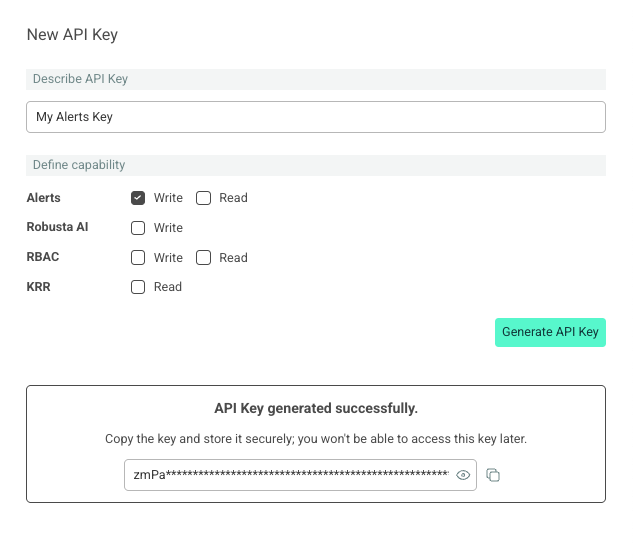
Click New API Key. Select a name for your key, and check the Alerts Write capability.
Generate and save your new API Key
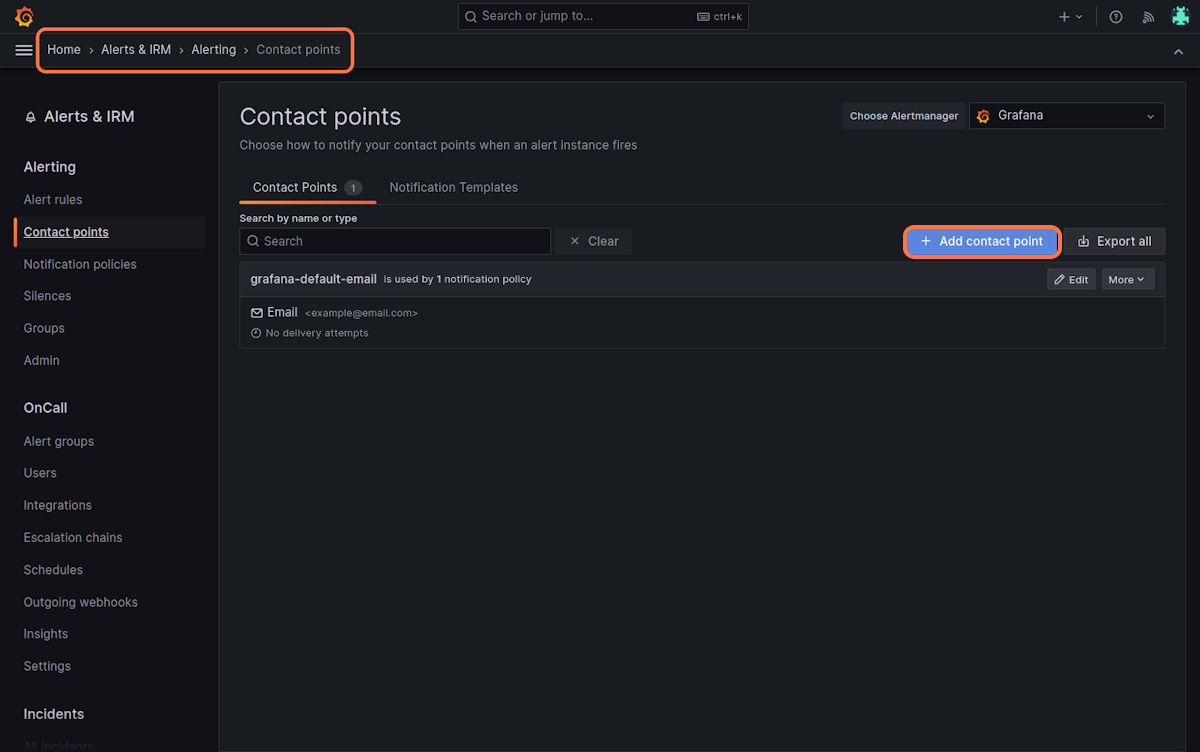
In the Grafana UI, navigate to the
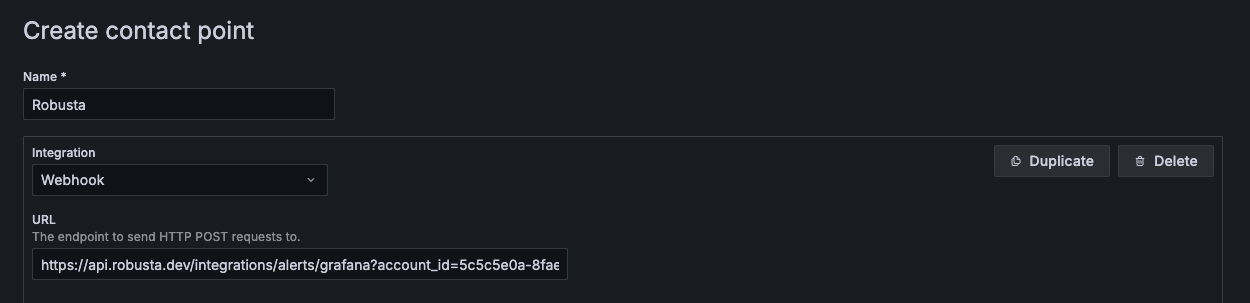
Alertingtab, click onManage Contact Points, and thenCreate contact point.
Select Webhook from the Integration options.
Add the following URL. Add your account_id to it:
https://api.robusta.dev/integrations/alerts/grafana?account_id=YOUR_ACCOUNT_ID
On the Optional Webhook settings add your API Key in the Bearer Token field:
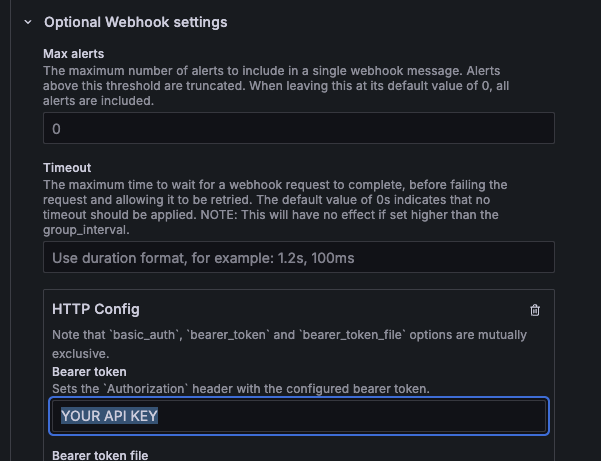
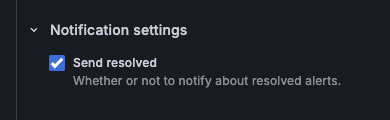
Lastly, on the Notification settings, check the Send resolved checkbox:
Click the Test button. If successful, you will receive a notification in the Robusta UI under the external cluster.
Save your new Contact Point
4. Create a new Notification Policy. Navigate to Alerting tab, and click Manage notification policies
Create a new policy.
Add a policy without matchers, that handles all alerts. Disable grouping, by specifying Group By = ...
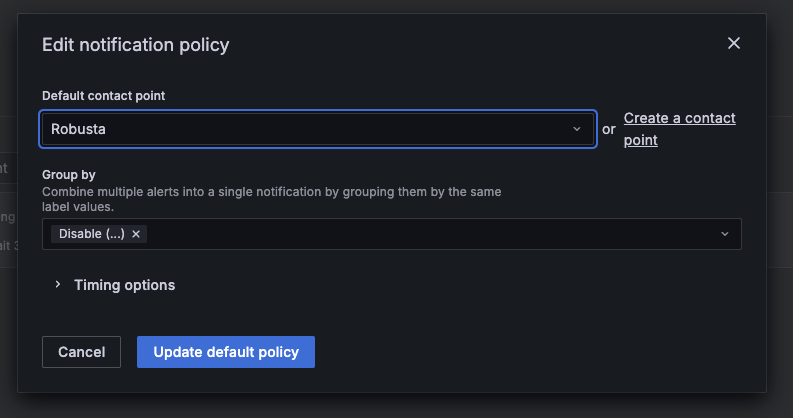
Save your new Notification Policy
That's it!
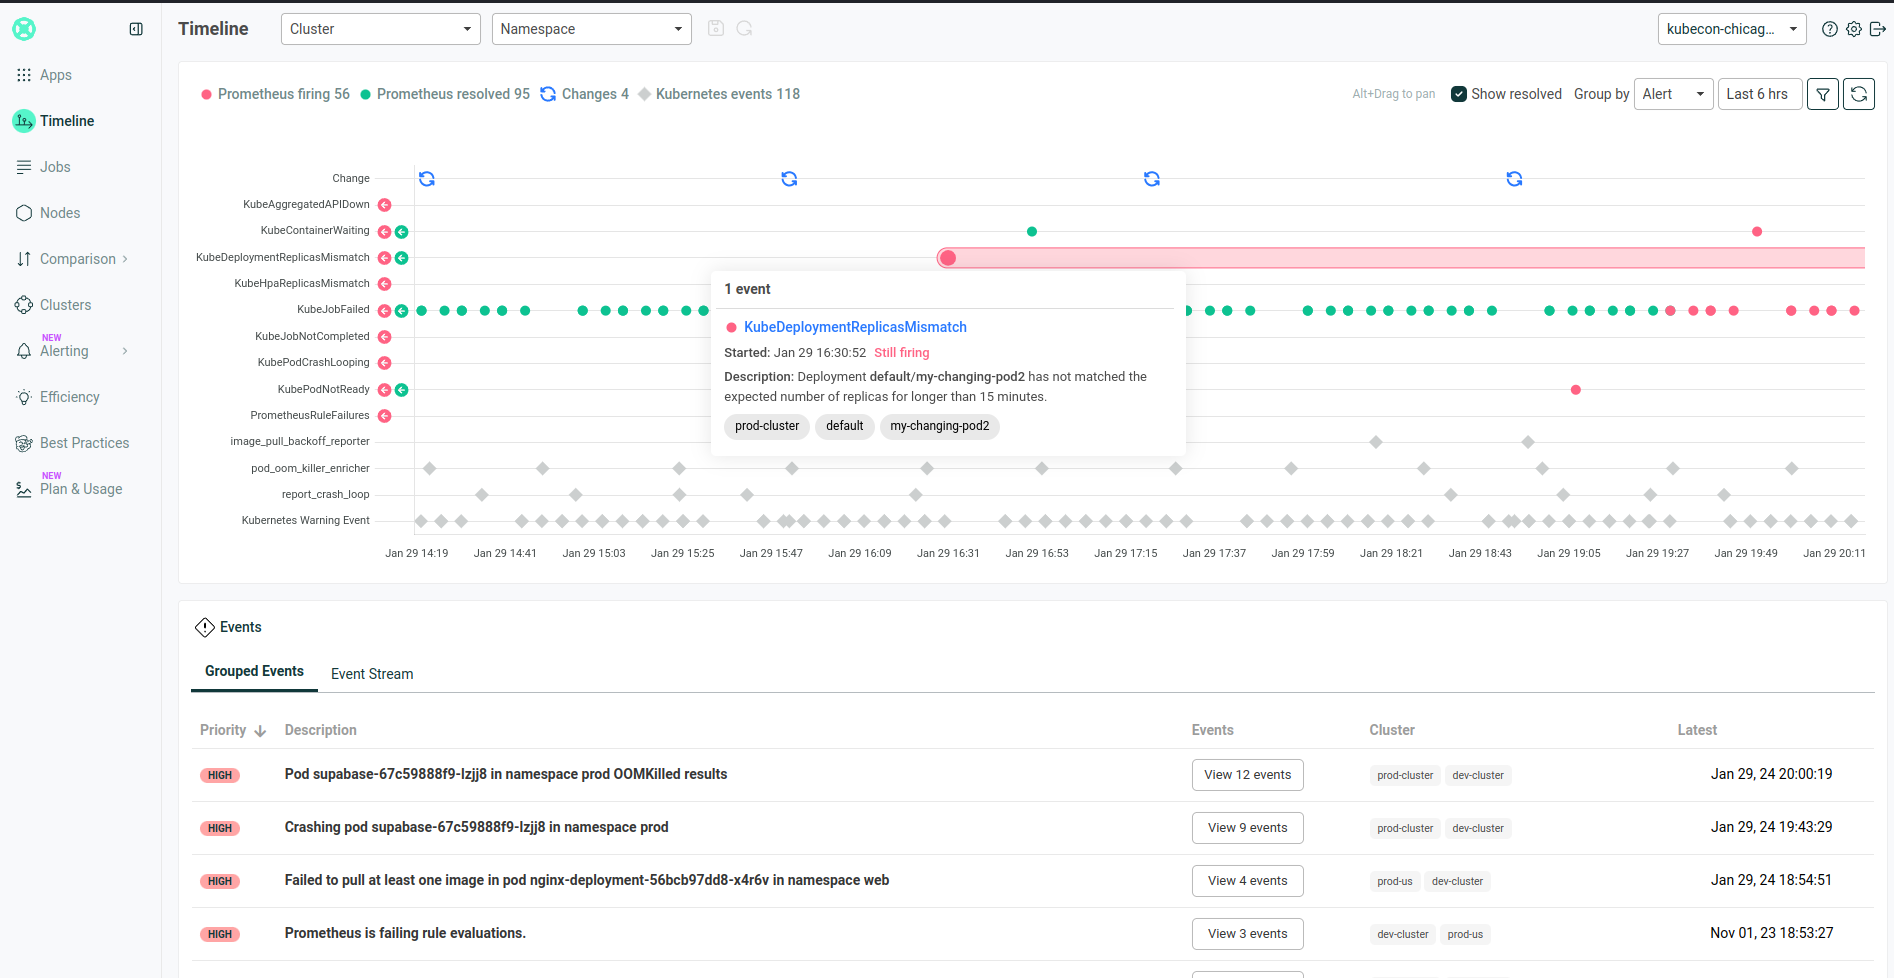
You can now see your Grafana alerts in the Robusta Timeline, and use AI to analyze it.
Kubernetes Alerts
In case your alerts are from a Kubernetes cluster monitored by Robusta, and your alerts has a cluster label, make sure it matches the cluster_name that appears in Robusta generated_values.yaml.
** This is optional - you can send any alert to the Robusta timeline! **
Send Alerts to Robusta for enrichments
You can use Robusta to enrich alerts with extra context, and to route it to other systems as well.
If you'd like to do that, this integration is for you.
To configure it:
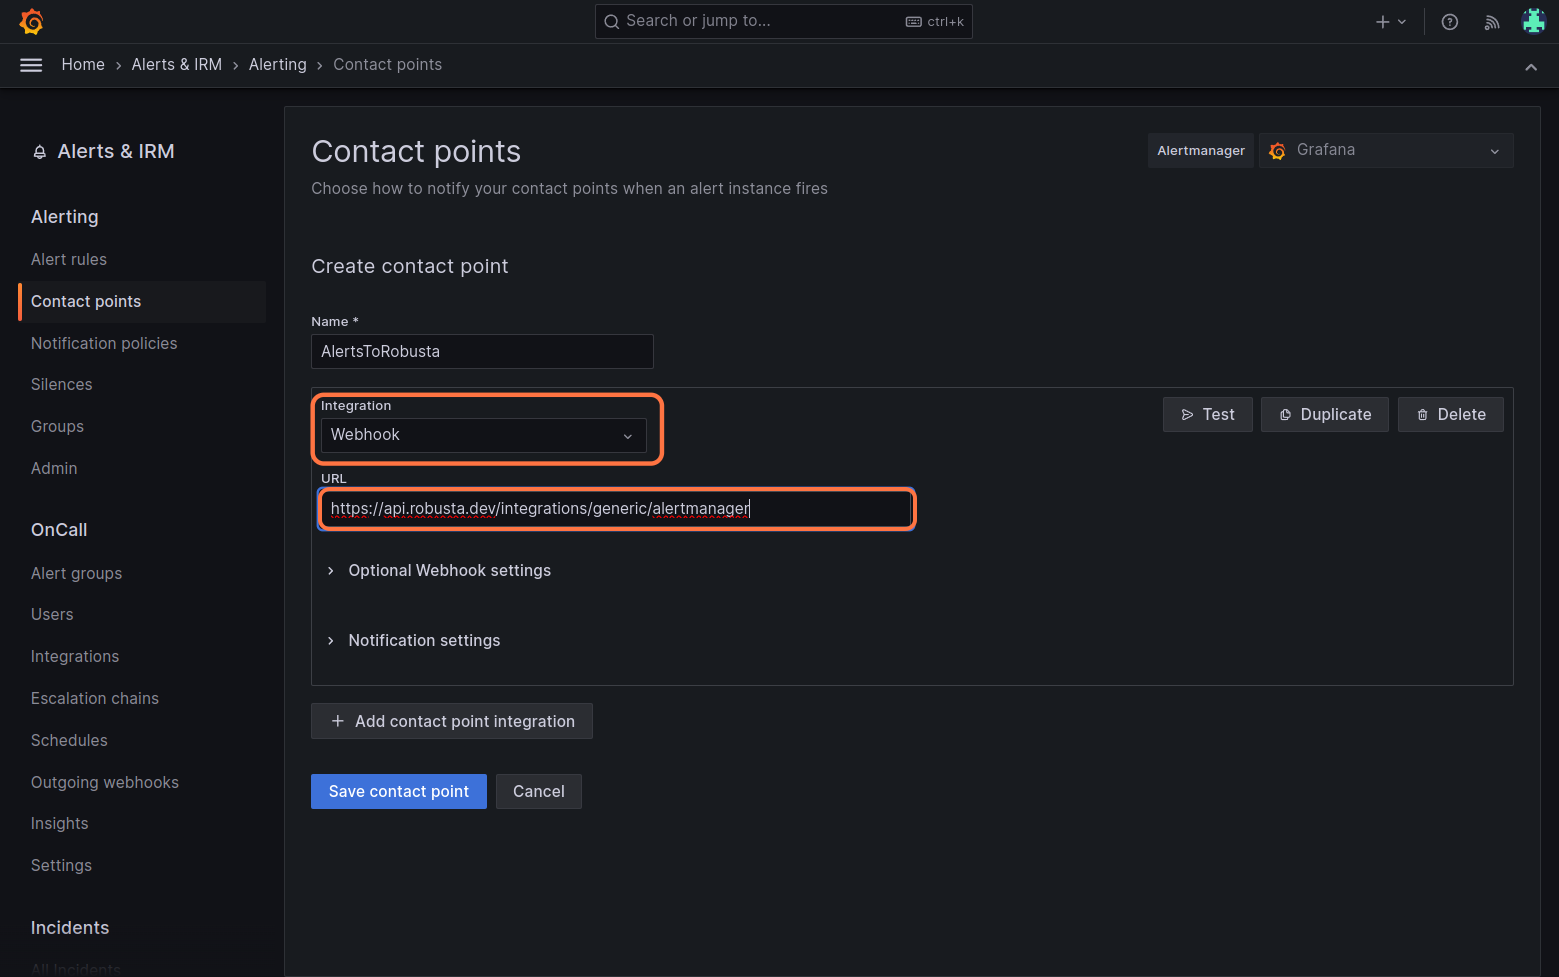
In the Grafana UI, navigate to the
Alertingtab, click onAdd contact point, and selectWebhookfrom the Integration options.
Insert the following URL:
https://api.robusta.dev/integrations/generic/alertmanager
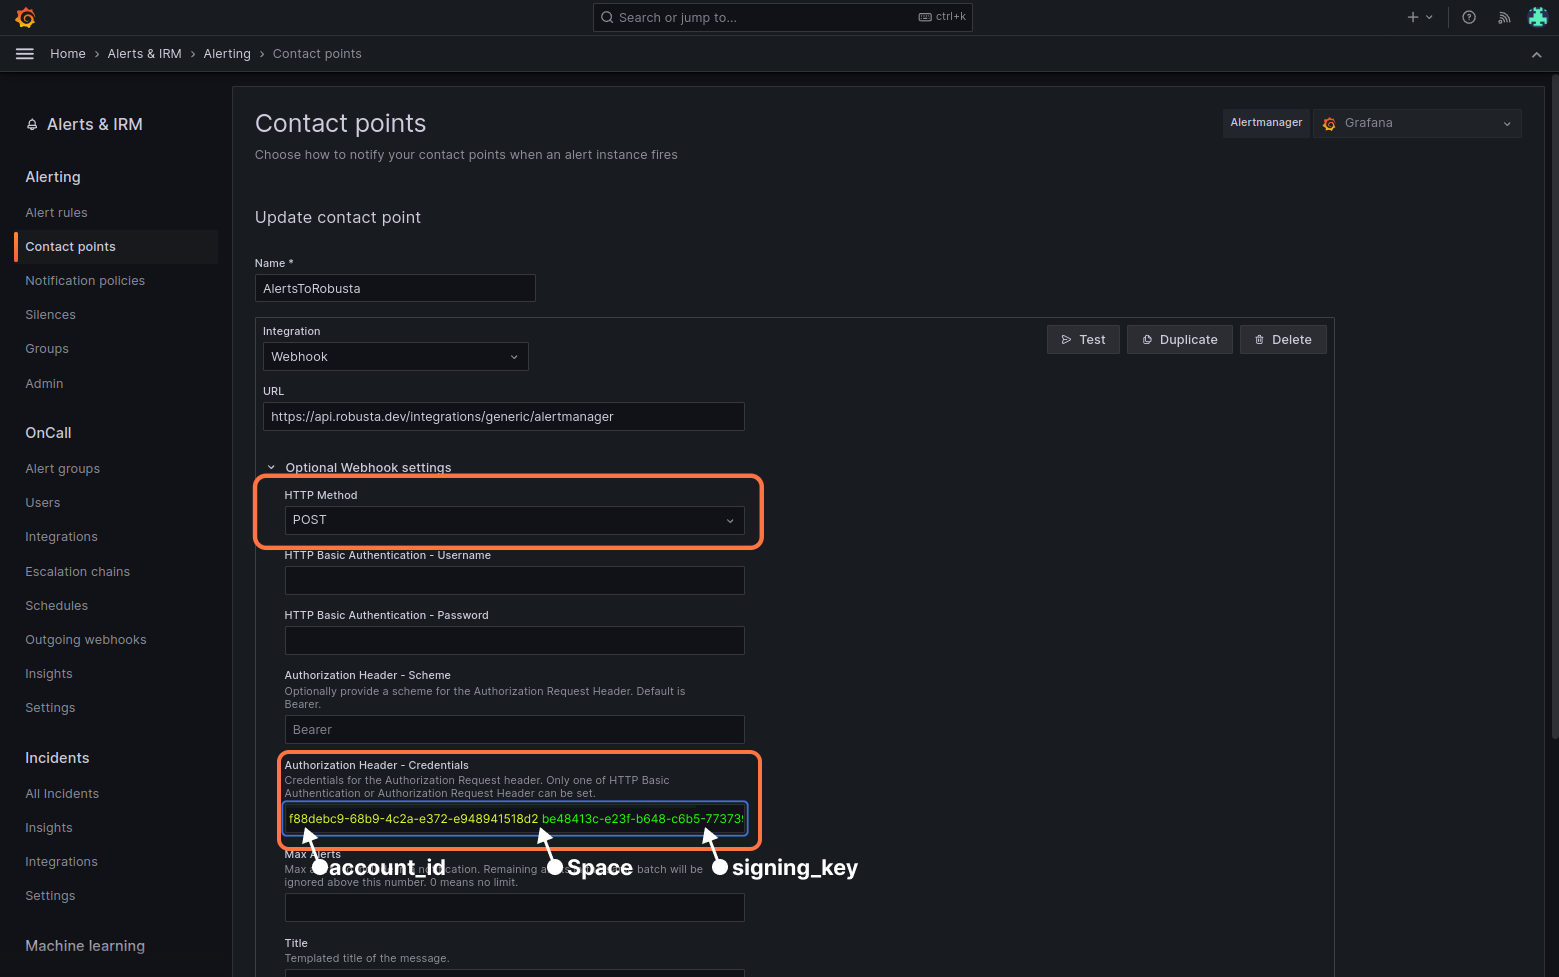
Change the HTTP Method to POST in the
Optional Webhook Settings.Enter your
<account_id> <signing_key>in theAuthorization Headers - Credentialsbox (locate this in your generated_values.yaml file).For example, if
account_id: f88debc9-68b9-4c2a-e372-e948941518d2andsigning_key: be48413c-e23f-b648-c6b5-773739a377f7, then usef88debc9-68b9-4c2a-e372-e948941518d2 be48413c-e23f-b648-c6b5-773739a377f7as the value.
Click "Test" button. Select "custom" and add a
cluster_nameorclusterlabel to send a test alert (Robusta requires that every alert have thecluster_nameorclusterlabel).
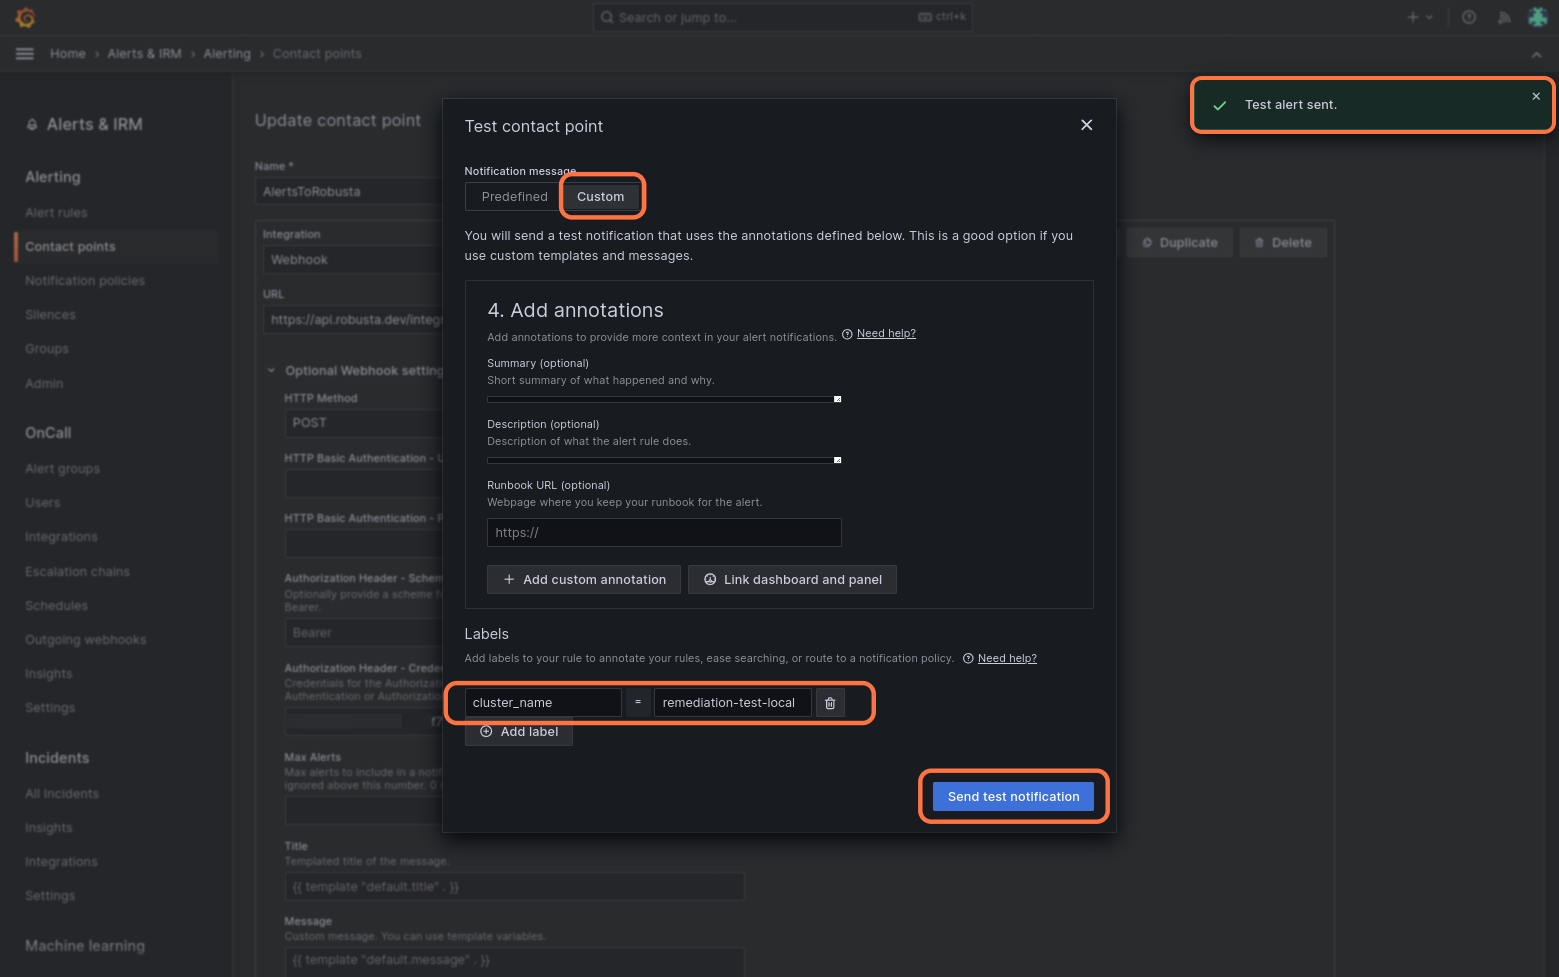
If successful, you will receive a notification in the Robusta UI, Slack or any other destination configured in Robusta, such as Microsoft Teams.

Finally, click "Save contact point" to complete the Robusta integration.
Configure Silencing
Modify and add the following config to generated_values.yaml and update Robusta.
globalConfig: # this line should already exist
    # add the lines below
    grafana_url: "https://<grafana url>.grafana.net"
    # Create alert silencing when using Grafana alerts
    grafana_api_key: <YOUR GRAFANA EDITOR API KEY>
    alertmanager_flavor: grafana # (1)

    # alertmanager_url: "https://alertmanager<url>.grafana.net"
    # prometheus_url: "https://prometheus<url>.grafana.net/api/prom"

    # Add any labels that are relevant to the specific cluster (optional)
    # prometheus_additional_labels:
    #   cluster: 'CLUSTER_NAME_HERE'

    # If using a multi-tenant prometheus or alertmanager, pass the org id to all queries
    # prometheus_additional_headers:
    #   X-Scope-OrgID: <org id>
    # alertmanager_additional_headers:
    #   X-Scope-OrgID: <org id>
This is necessary for Robusta to create silences when using Grafana Alerts, because of minor API differences in the AlertManager embedded in Grafana.
Note
The Grafana API key must have the Editor role in order to create silences.
You can optionally set up authentication, SSL verification, and other parameters described below.
Verify it Works
Open any application in the Robusta UI. If CPU and memory graphs are shown, everything is working.
Alternatively, trigger a demo OOMKill alert and confirm that Robusta sends a Slack/Teams message with a memory graph. This indicates proper configuration.
Optional Settings
Authentication Headers
If Prometheus and/or AlertManager require authentication, add the following to generated_values.yaml:
globalConfig:
  prometheus_auth: Bearer <YOUR TOKEN> # Replace <YOUR TOKEN> with your actual token or use any other auth header as needed
  alertmanager_auth: Basic <USER:PASSWORD base64-encoded> # Replace <USER:PASSWORD base64-encoded> with your actual credentials, base64-encoded, or use any other auth header as needed
These settings may be configured independently.
SSL Verification
By default, Robusta does not verify the SSL certificate of the Prometheus server.
To enable SSL verification, add the following to Robusta's generated_values.yaml:
runner:
  additional_env_vars:
  - name: PROMETHEUS_SSL_ENABLED
    value: "true"
If you have a custom Certificate Authority (CA) certificate, add one more setting:
runner:
  certificate: "<YOUR BASE-64 ENCODED DATA>" # base64-encoded certificate value