Grafana AlertManager
Grafana can send alerts to Robusta for automatic enrichment and visualization.
This guide only covers integrating alerts from Grafana Alerting with Robusta, not configuring Robusta to query metrics from the relevant Grafana data source.
After completing this tutorial, we recommend configuring a metrics integration according to the standard instructions for your metrics backend
Prerequisite
A label in the following format
cluster_name: YourClusterNameadded to each alert, with the cluster name as it appears in Robustagenerated_values.yaml.
Send Alerts to Robusta
This integration lets you send Grafana alerts to Robusta.
To configure it:
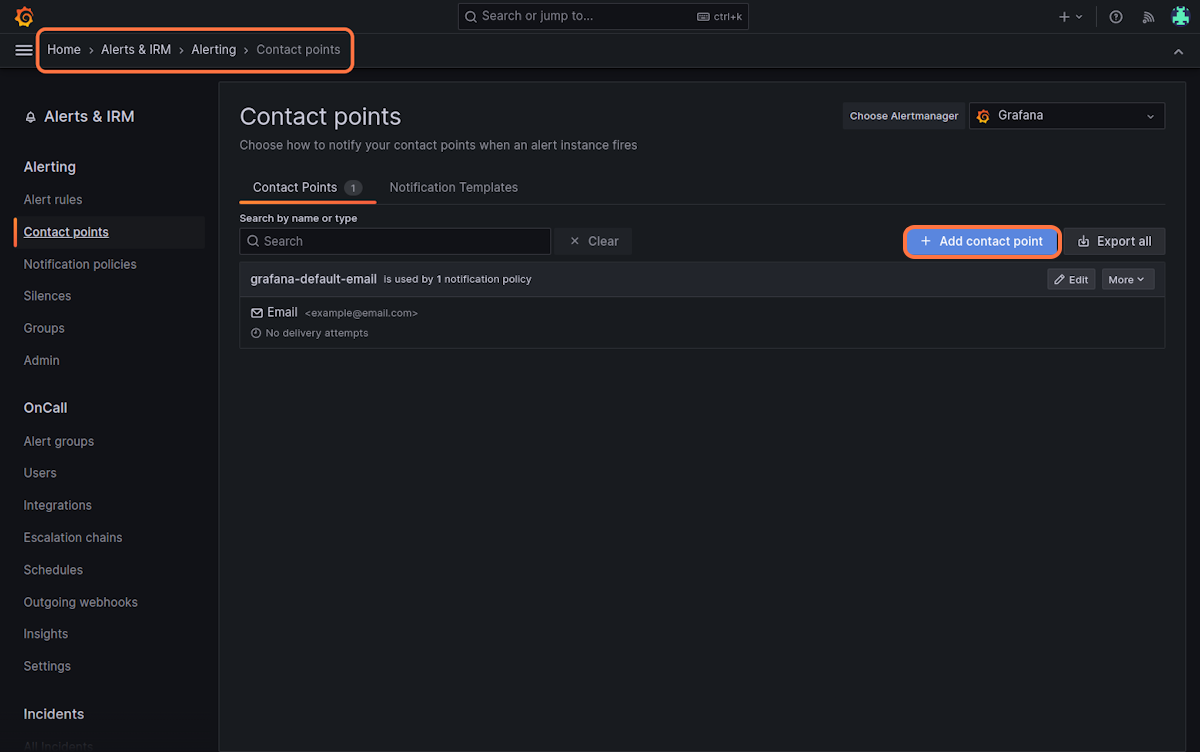
In the Grafana UI, navigate to the
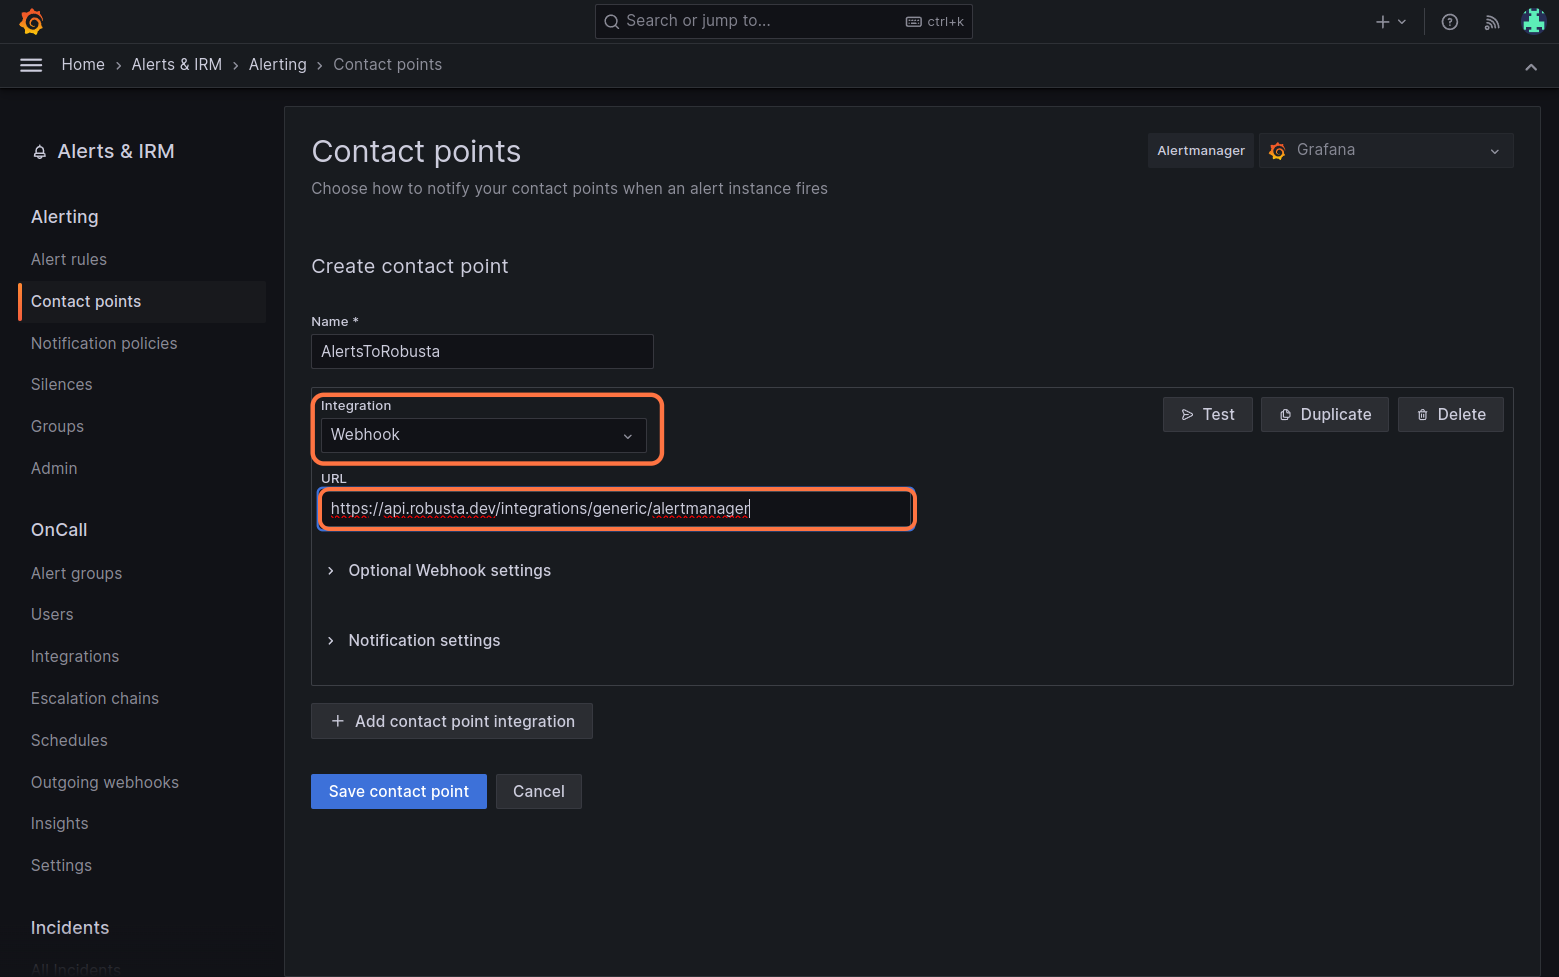
Alertingtab, click onAdd contact point, and selectWebhookfrom the Integration options.
Insert the following URL:
https://api.robusta.dev/integrations/generic/alertmanager
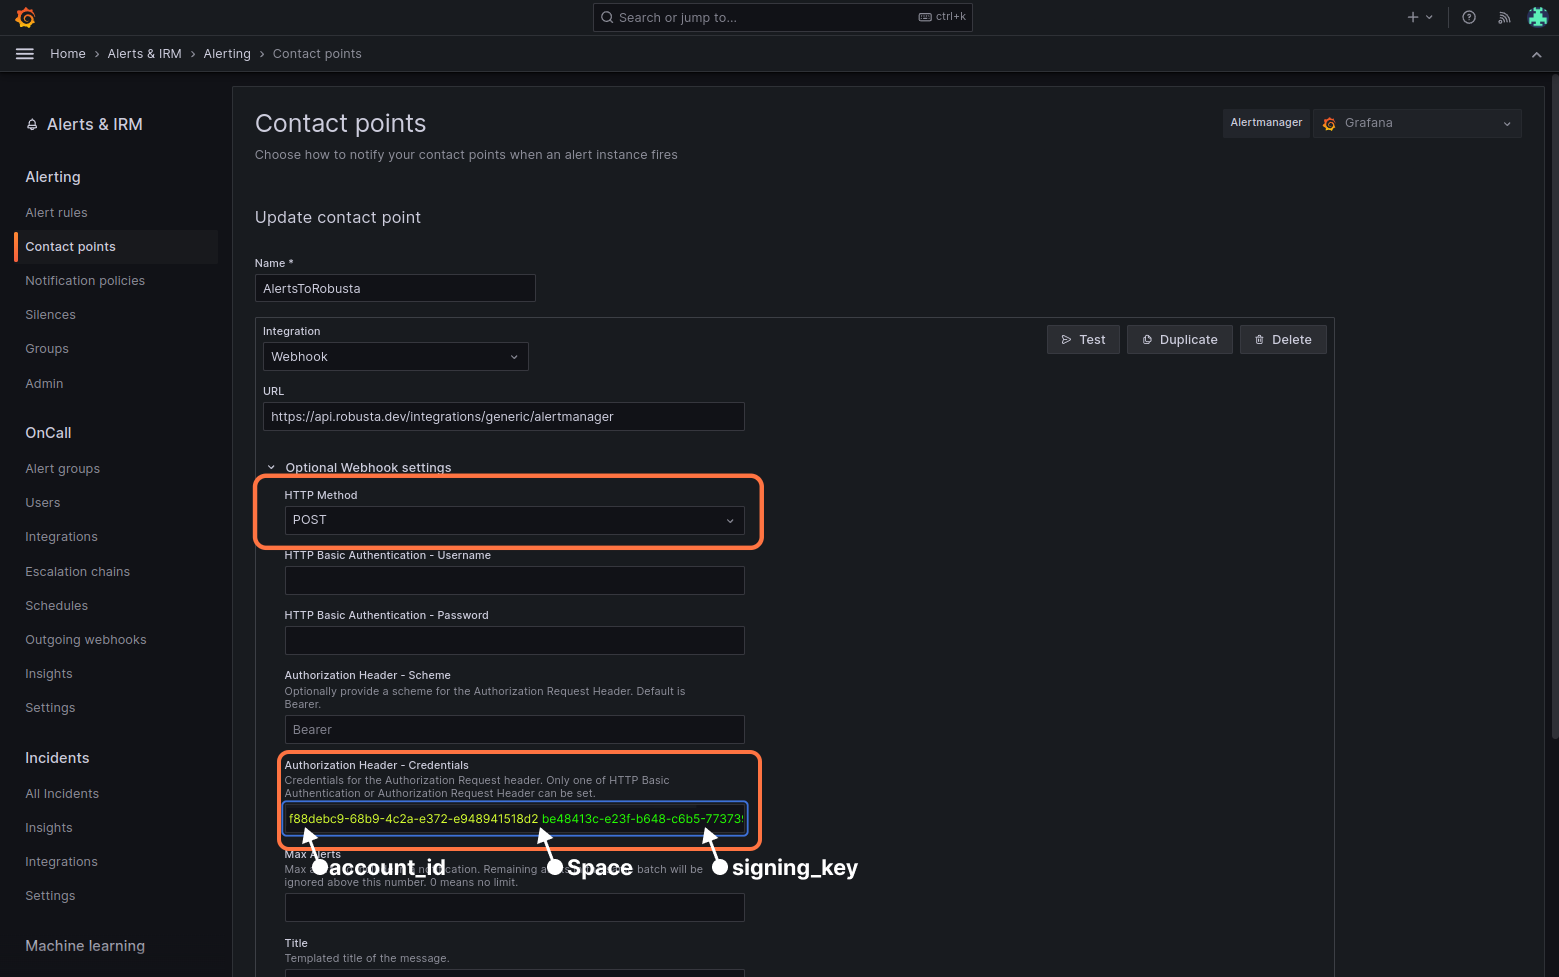
Change the HTTP Method to POST in the
Optional Webhook Settings.Enter your
<account_id> <signing_key>in theAuthorization Headers - Credentialsbox (locate this in your generated_values.yaml file).For example, if
account_id: f88debc9-68b9-4c2a-e372-e948941518d2andsigning_key: be48413c-e23f-b648-c6b5-773739a377f7, then usef88debc9-68b9-4c2a-e372-e948941518d2 be48413c-e23f-b648-c6b5-773739a377f7as the value.
Click "Test" button. Select "custom" and add a
cluster_nameorclusterlabel to send a test alert (Robusta requires that every alert have thecluster_nameorclusterlabel).
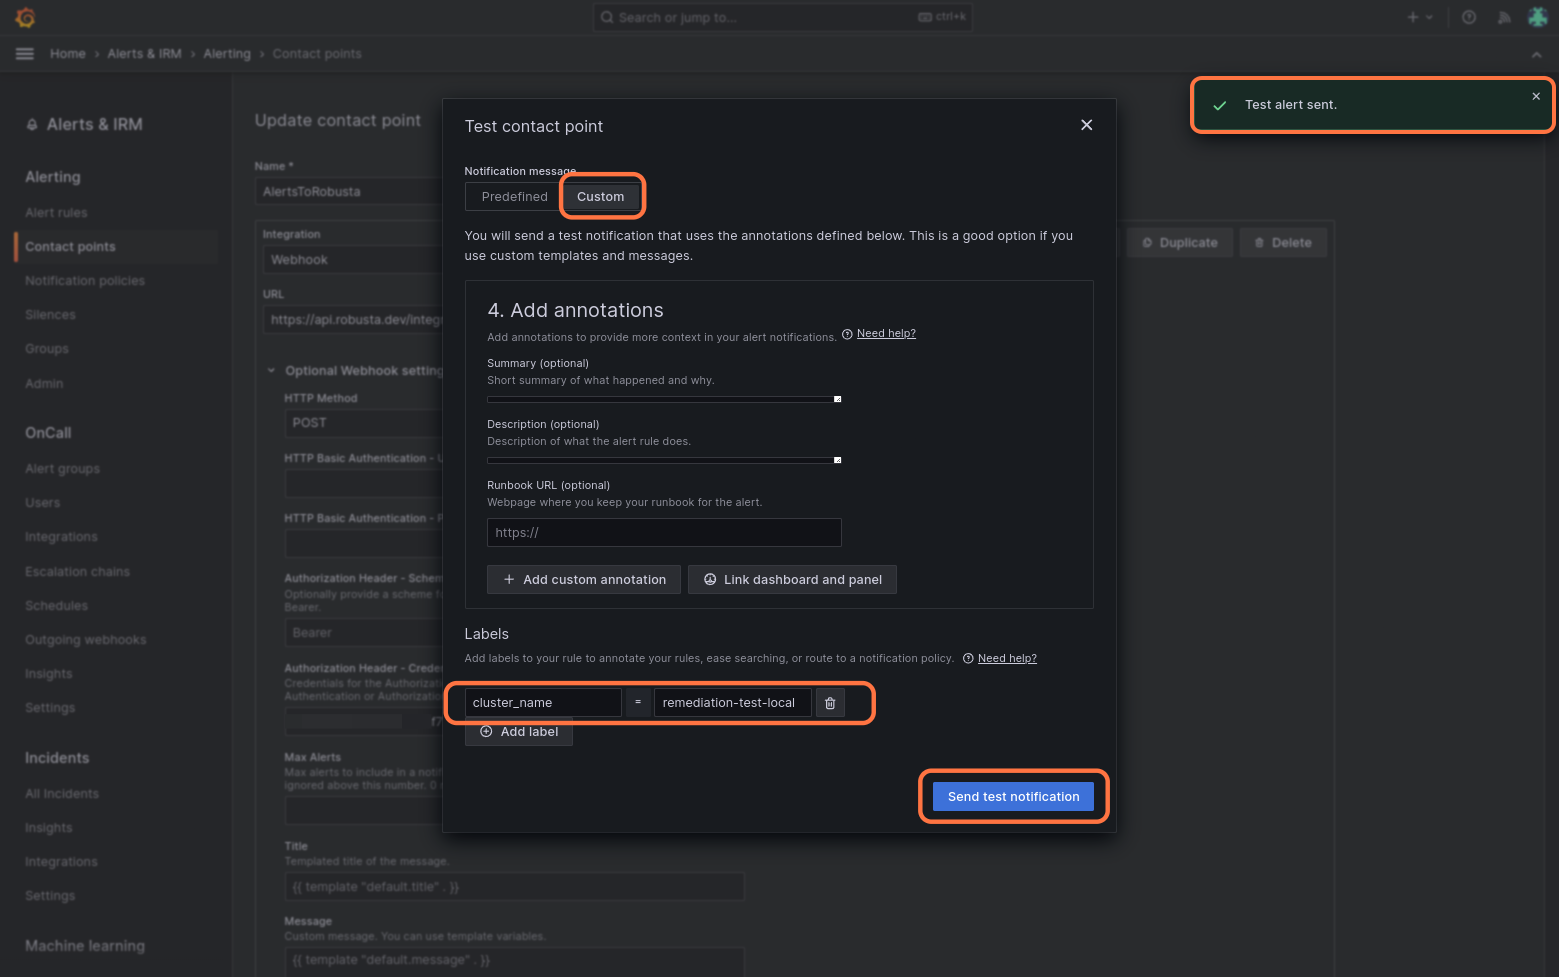
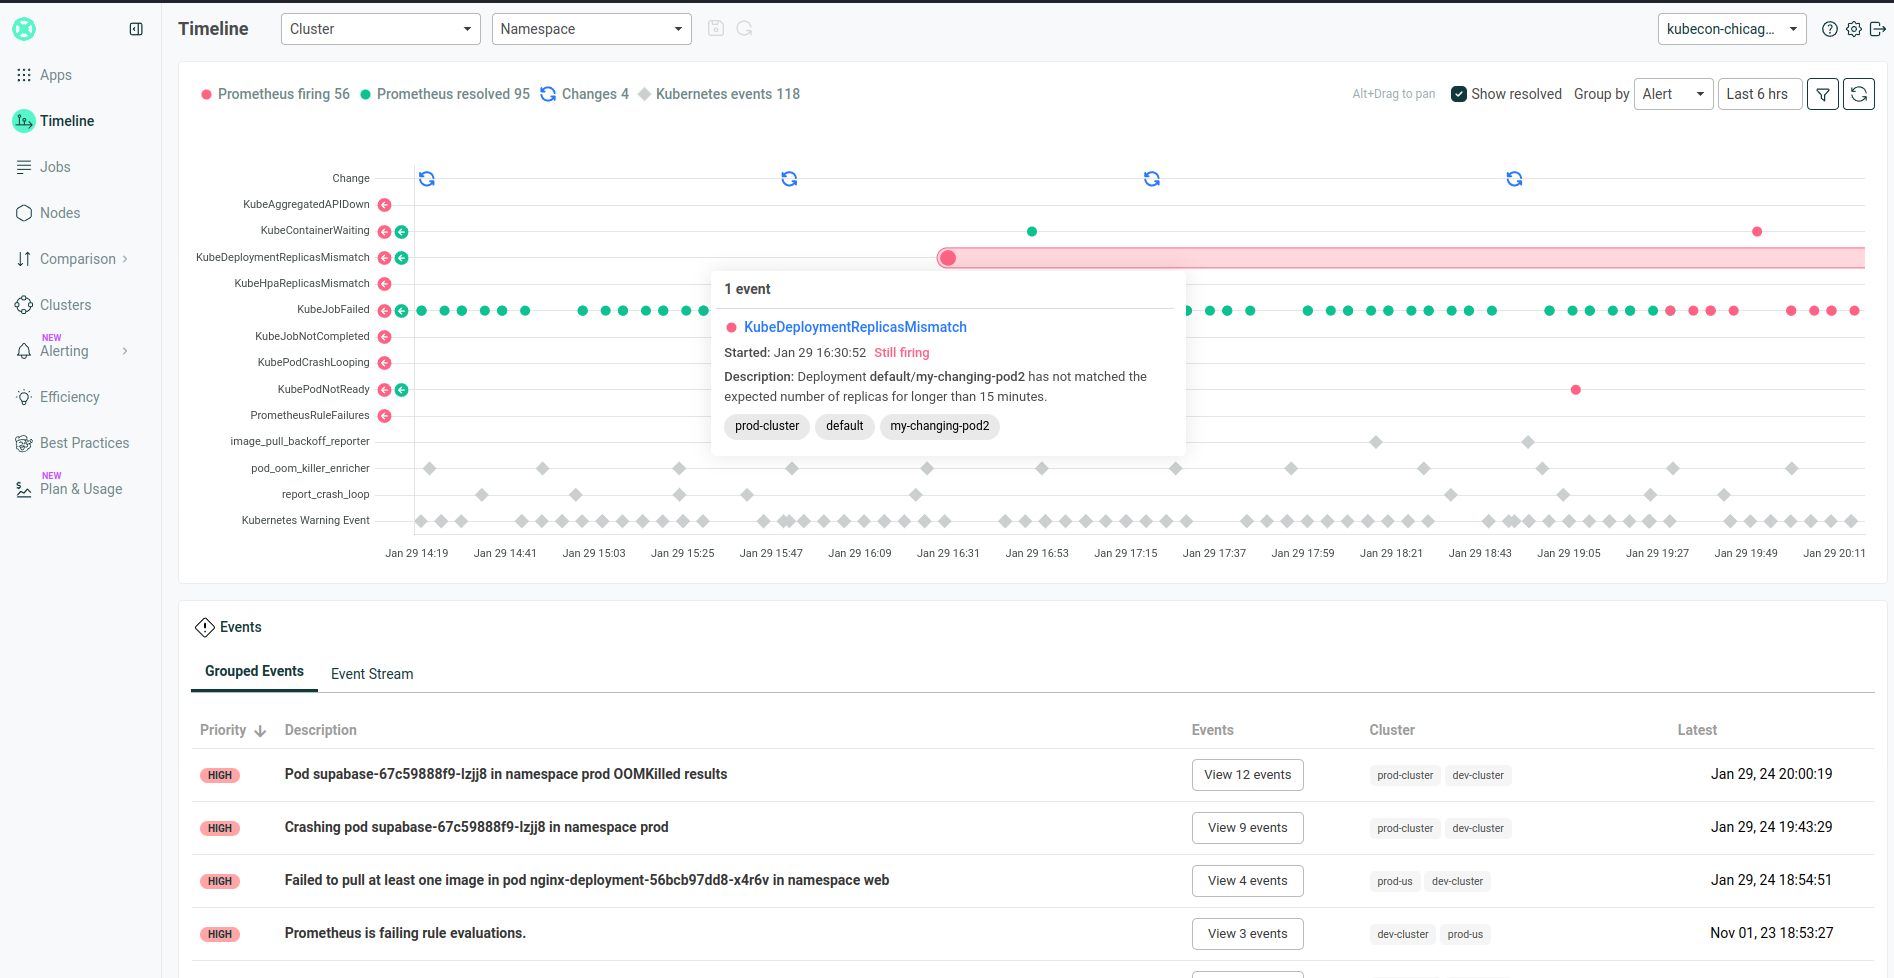
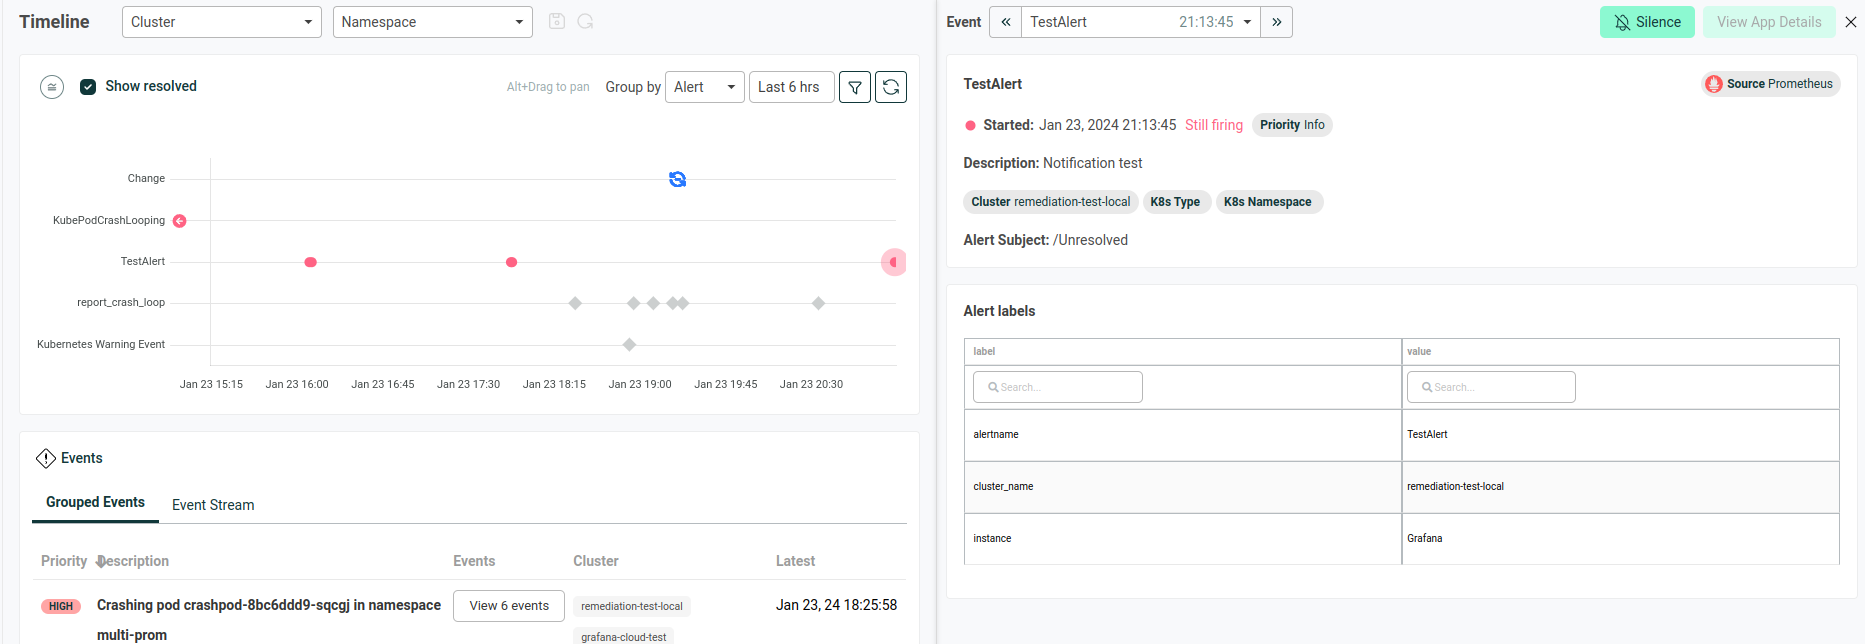
If successful, you will receive a notification in the Robusta UI, Slack or any other destination configured in Robusta, such as Microsoft Teams.
Finally, click "Save contact point" to complete the Robusta integration.
Configure Silencing
Modify and add the following config to generated_values.yaml and update Robusta.
globalConfig: # this line should already exist
    # add the lines below
    grafana_url: "https://<grafana url>.grafana.net"
    # Create alert silencing when using Grafana alerts
    grafana_api_key: <YOUR GRAFANA EDITOR API KEY>
    alertmanager_flavor: grafana # (1)

    # alertmanager_url: "https://alertmanager<url>.grafana.net"
    # prometheus_url: "https://prometheus<url>.grafana.net/api/prom"

    # Add any labels that are relevant to the specific cluster (optional)
    # prometheus_additional_labels:
    #   cluster: 'CLUSTER_NAME_HERE'
This is necessary for Robusta to create silences when using Grafana Alerts, because of minor API differences in the AlertManager embedded in Grafana.
Note
The Grafana API key must have the Editor role in order to create silences.
You can optionally set up authentication, SSL verification, and other parameters described below.
Verify it Works
Open any application in the Robusta UI. If CPU and memory graphs are shown, everything is working.
Alternatively, trigger a demo OOMKill alert and confirm that Robusta sends a Slack/Teams message with a memory graph. This indicates proper configuration.
Optional Settings
Authentication Headers
If Prometheus and/or AlertManager require authentication, add the following to generated_values.yaml:
globalConfig:
  prometheus_auth: Bearer <YOUR TOKEN> # Replace <YOUR TOKEN> with your actual token or use any other auth header as needed
  alertmanager_auth: Basic <USER:PASSWORD base64-encoded> # Replace <USER:PASSWORD base64-encoded> with your actual credentials, base64-encoded, or use any other auth header as needed
These settings may be configured independently.
SSL Verification
By default, Robusta does not verify the SSL certificate of the Prometheus server.
To enable SSL verification, add the following to Robusta's generated_values.yaml:
runner:
  additional_env_vars:
  - name: PROMETHEUS_SSL_ENABLED
    value: "true"
If you have a custom Certificate Authority (CA) certificate, add one more setting:
runner:
  certificate: "<YOUR BASE-64 ENCODED DATA>" # base64-encoded certificate value